The Dow climbed Tuesday, to end the month in the green as investors digested a slew of mostly better-than-expected results just as focus shifts to the Federal Reserve decision due Wednesday.
The Dow Jones Industrial Average gained 1.1%, or 368 points, ending the month with a gain of about 2%. The Nasdaq Composite closed 1.7% higher. The S&P 500 rose 1.4% notching its best January since 2019.
US Treasury bond yields are downtrend slightly by 0.013% to 3.516%.

The Employment Cost Index (ECI) report released on Tuesday had an unusual impact across financial markets, with the US Dollar weakening after the numbers. Analysts at Well Fargo point out that the figures are one more in the list of inflation readings over which the Federal Reserve is breathing a little easier. They point out that while the report further supports inflation moving back toward the 2% target, labor cost growth remains too strong to be consistent with it staying there for the long haul.
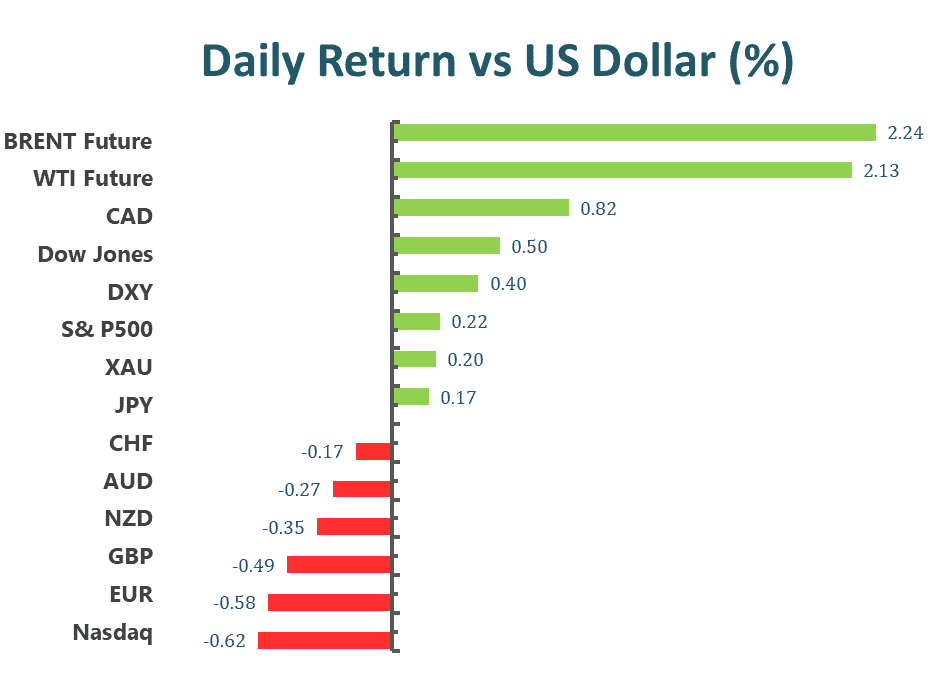
Main Pairs Movement
DXY gauges the greenback vs. a bundle of its main rivals comes all over the way down to the 102.30 region after climbing to as high as the 102.60 area earlier on Tuesday. At the time of writing, the DXY exchanges hand at 102.089, dropping around 0.15% on the daily chart.
The EUR/USD pair is showing signs of a loss in the upside momentum after reaching near the immediate resistance of 1.0870 in the early Tokyo session. The shared currency pair has already displayed a responsive buying action after dropping to near the round-level support at 1.0800.
GBP/USD fails to cheer the US Dollar weakness much as Cable’s recovery from the weekly low fades around 1.2320 during early Wednesday. In doing so, the quote seems to justify the downbeat catalysts at home, mainly relating to inflation and housing markets.
XAUUSD stopped consecutive three days down trend, rebound around 0.26%, and closed at 1928 marks.
The yellow metal managed to cheer the broad US Dollar weakness, backed by the United States data and firmer equities.
Technical Analysis
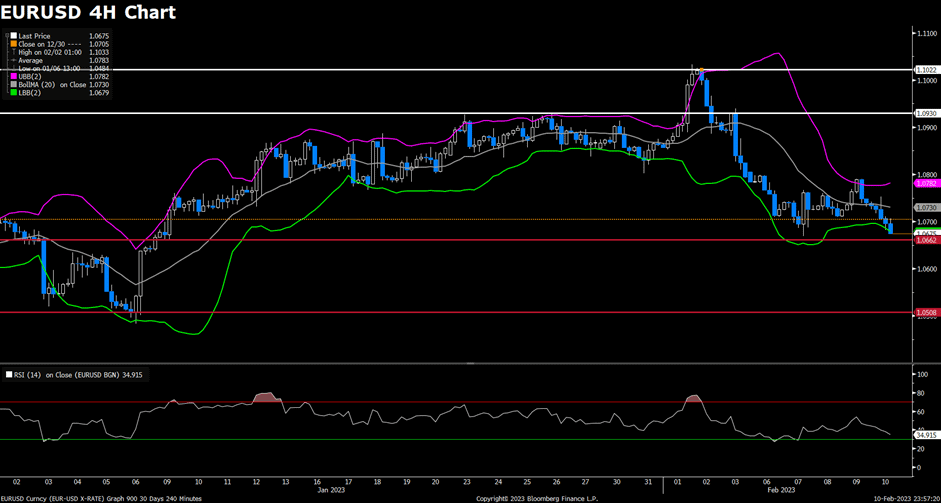
EURUSD (4-Hour Chart)
The EUR/USD pair edged lower on Tuesday, coming under pressure but then rebounded slightly towards the 1.0850 area amid recovering market sentiment. The pair is now trading at 1.0854, posting a 0.06% gain on a daily basis. EUR/USD stays in the positive territory amid renewed US Dollar weakness, as the greenback lost its strength following the release of US labor costs data for the fourth quarter and allowed the EUR/USD pair to pull away from session lows. The US Employment Cost Index rises by 1% in Q4, which came in below the market expectation of 1% and points to more evidence of a slowdown in inflation. Therefore, the greenback tumbled after the report and lend support to the EUR/USD pair. In the Eurozone, the better-than-anticipated Euro-Zone Gross Domestic Product (GDP) failed to push the Euro higher as German Retail Sales plunged by 5.3% MoM in December, which is much worse than expected.
For the technical aspect, RSI indicator 49 figures as of writing, suggesting that the risk skews to the upside as the RSI is rising sharply towards the mid-line. As for the Bollinger Bands, the price regained upside momentum and rebounded toward the moving average, therefore a continuation of the upside trend can be expected. In conclusion, we think the market will be bullish as the pair is heading to test the 1.0868 resistance level. Bulls could take control of the pair if it breaks above the aforementioned resistance.
Resistance: 1.0868, 1.0918, 1.0942
Support: 1.0830, 1.0780, 1.0722
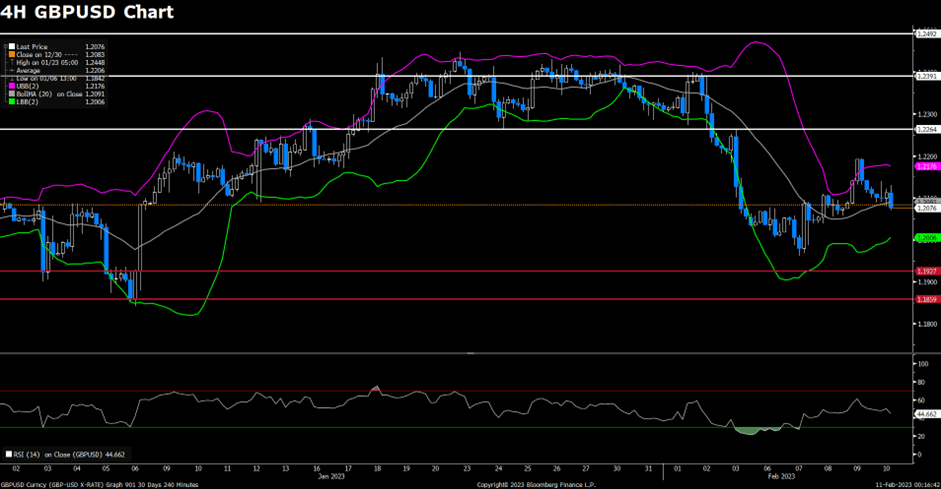
GBPUSD (4-Hour Chart)
GBP/USD continued to trade lower towards 1.2300 early Tuesday as the US dollar index maintained its strength amid risk-off sentiment. The pair is now trading at 1.2328, posting a 0.19% loss on a daily basis. GBP/USD could suffer additional losses in the near term if buyers fail to hold 1.2300. On Wednesday, the Fed would be the first to release the interest rate, expected to increase by 25bps, while the BoE is estimated to raise rates by 50bps, leaving the Bank Rate at 4%. Most analysts expect this would be the last increase by the BoE, which could exert some pressure on GBP/USD as rates in the US are expected to peak at 5%.
For the technical aspect, RSI indicator 41 figures as of writing, falling below mid-line as GBP/USD witnessed some short selling. As for the Bollinger Bands, the moving average started to move down, signaling that the current trend started to change modestly. A downtrend could persist. In conclusion, we think the market is in modest bearish mode as both indicators show some bearish potential. For the uptrend scenario, the price needs a firm break above resistance at 1.2426 to show bullish impetus. For the downtrend scenario, if the price drop below the support at 1.2292, it may trigger some technical selling and drag the GBP/USD pair further toward the next support at 1.2188.
Resistance: 1.2426, 1.2493, 1.2593
Support: 1.2292, 1.2188, 1.2000
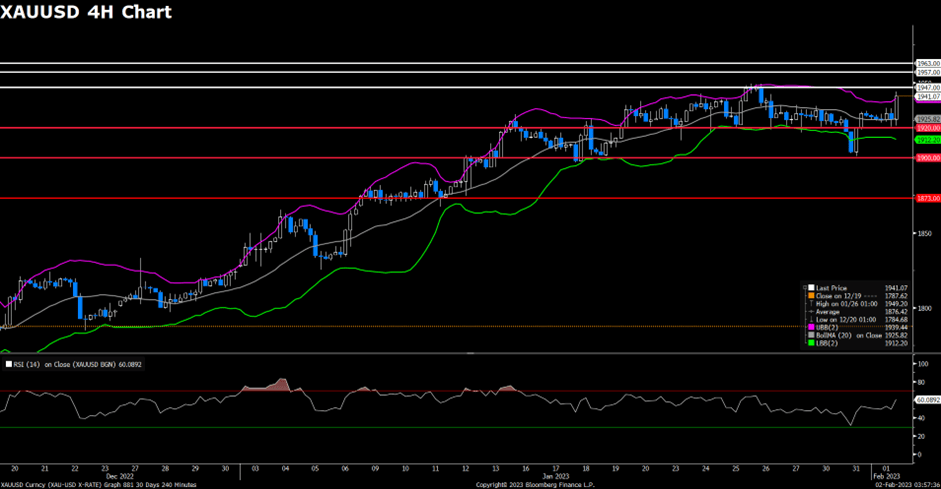
XAUUSD (4-Hour Chart)
The gold price was volatile on Tuesday. Earlier, the Gold price tumbled to $1,900.94, slightly above the round-figure mark of $1,900, as the US dollar index strengthened. However, traders turned their back on the US dollar later in the US trading session, and the Gold price managed to recover its lost territory back to the $1930 level. At the time of writing, the Gold price is trading at $1,929.94, posting a 0.36% gain on a daily basis. On the other hand, The Fed will announce its policy decision at the end of a two-day meeting on Wednesday and is expected to raise interest rates by 25 bps. Apart from this, traders will focus on the Bank of England (BoE) meeting and the European Central Bank (ECB) decision, both scheduled on Thursday. Any hawkish signals from major central banks will more likely be negative for Gold prices.
For the technical aspect, RSI indicator 53 figures as of writing, surging from oversell region as prices recover strongly from $1900. As for the Bollinger Bands, the price surged from the lower band and currently holds around the moving average. In conclusion, we think the market is in a modest bearish mode. Though both indicators show no strong bearish signal, the price has made a lower low on correction and the fundamental outlook seems weighing on the gold price as well. For the downtrend scenario, the current support is at the $1900 round-figure mark. If the price closes below critical support at $1900, bulls may surrender and trigger some follow-through selling. For the uptrend scenario, the pair should establish itself above the current support at $1900. To regather bullish strength, it should also recover the lost territory from the multi-month high around the $1,949 zone, which has become a strong barrier in the near term for bulls.
Resistance: 1947, 1957, 1963
Support: 1900, 1873
Economic Data
| Currency | Data | Time (GMT + 8) | Forecast |
| CNY | Caixin Manufacturing PMI (Jan) | 09:45 | 49.5 |
| EUR | German Manufacturing PMI (Jan) | 16:55 | 47 |
| GBP | Manufacturing PMI (Jan) | 17:30 | 46.7 |
| EUR | CPI (YoY) (Jan) | 18:00 | 9.00% |
| USD | ADP Nonfarm Employment Change (Jan) | 21:15 | 178K |
| USD | ISM Manufacturing PMI (Jan) | 23:00 | 48 |
| USD | JOLTs Job Openings (Dec) | 23:00 | 10.250M |
| USD | Crude Oil Inventories | 23:30 | 0.376M |

Situs ini menggunakan cookie untuk memberimu pengalaman pengguna yang luar biasa.
Dengan menggunakan vtmindo.com, kamu menerima kebijakan cookie kami.


![]()
Follow us on:


![]()