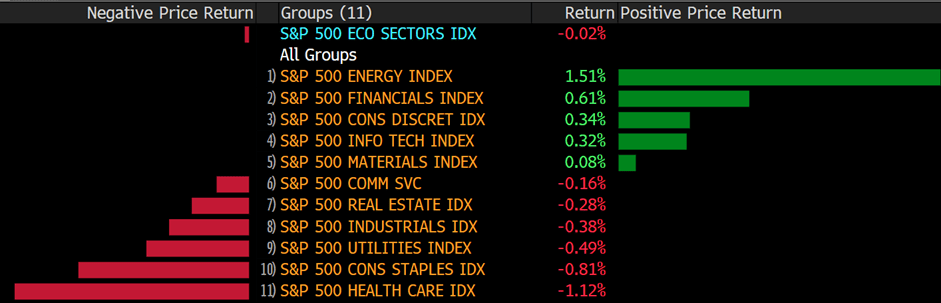
On Monday, US stocks extended their losses from the previous week as investors returned from a holiday weekend and prepared for another hectic week of corporate earnings reporting. Several large firms, including United Airlines (UAL), American Express (AXP), Netflix (NFLX), and Tesla (TSLA), released their most recent quarterly earnings reports. After oscillating between gains and losses throughout the session, the S&P 500 edged lower. Dow Jones and Nasdaq Composite both finished lower by 0.11 percent and 0.14 percent, respectively.
According to sources familiar with the subject, Apollo Global Management Inc. is interested in assisting with the financing of a bid for Twitter Inc. in response to Elon Musk’s $43 billion unsolicited offer to take the business private.
Apollo is considering a bid for Twitter and might provide Musk or another bidder, such as private equity company Thoma Bravo LP, with equity or financing to support an offer, the individuals said on condition of anonymity due to the nature of the conversations. According to one of the people, the involvement could take the shape of financing or preferred equity.
Twitter shares gained the most in two weeks on Monday as the social media firm launched a poison pill defense to foil Musk’s proposal to buy the company for $54.20 per share.
According to Bloomberg, Morgan Stanley is advising Musk, while Twitter has engaged the assistance of Goldman Sachs Group Inc. and JPMorgan Chase & Co. as it evaluates how to respond to Musk’s aggressive approach.
Main Pairs Movement
The US dollar held its ground against all of its main G10 peers, as the Dollar Index reached its highest level since April 2020 in the 100.80s. Traders noted expectations for a more aggressive Fed tightening cycle, which is evident in the rise in US rates across the curve, which boosted the greenback on Monday.
EUR/USD fell roughly 0.25 percent to retest the 1.0800 level and is now aiming for last week’s lows near 1.0750. GBP/USD fell roughly 0.4 percent to a little beyond 1.3000 and is also approaching annual lows, which are just below the 1.3000 mark in this case. NZD/USD plummeted almost 0.3 percent, falling below a critical level of support in the shape of the March low of 0.6728 and therefore reaching its lowest level since late February.
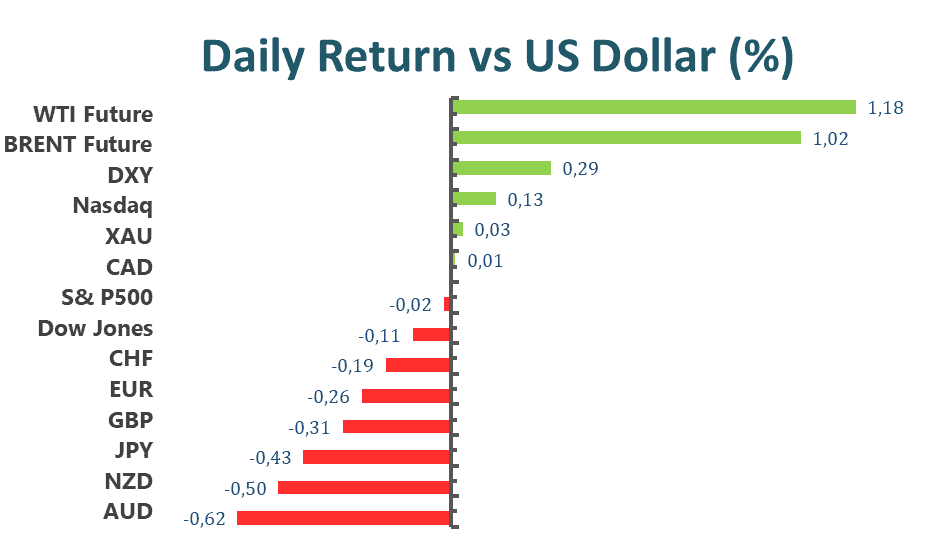
The Australian dollar was the poorest performance among the major G10 currencies, with AUD/USD plunging 0.6 percent to one-month lows below the 0.7350 level. The yen also performed poorly against a backdrop of rising US rates, with USD/JPY reaching its highest level since 2002 near 127.00. The loonie was the second-best performer among the G10 currencies, supported by increased oil prices. USD/CAD maintained a narrow range just around 1.2600 and below its 200- and 50-Day Moving Averages.
Commodities advanced for a third consecutive day on Monday. Gold briefly rose to nearly $2,000 per troy ounce but then retreated to more familiar levels by the day’s conclusion, closing 0.27 percent higher. Crude oils also posted modest increases, with WTI up 0.9 percent to $106.90 per barrel and Brent rising 1.38 percent to $112.70.
Technical Analysis
GBPUSD (4-Hour Chart)
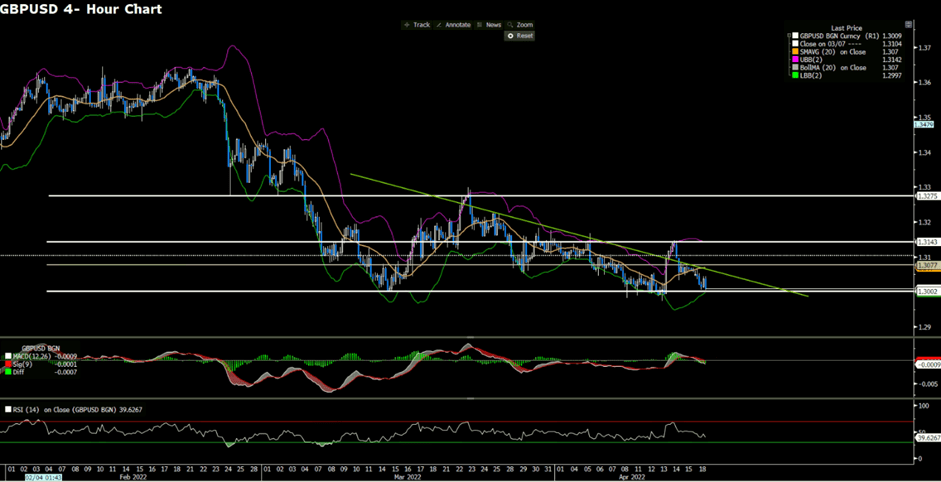
GBPUSD edges lower, staying below 1.3050, as the market mood remains cautious on Monday, boosting the greenback to the highest level. From the technical perspective, the decline from last week has brought GBPUSD to bearish territory. GBPUSD continues to lose traction, testing the support at 1.3002. The breakout of the support at 1.3002 will attract more sellers, accelerating the downside toward the next hurdle. In the meantime, the RSI indicator stays near 40, suggesting that the latest recovery attempt was a technical correction and the GBP buyers remain hesitant and cautious.
Resistance: 1.3077, 1.3275
Support: 1.3002
XAUUSD (4-Hour Chart)
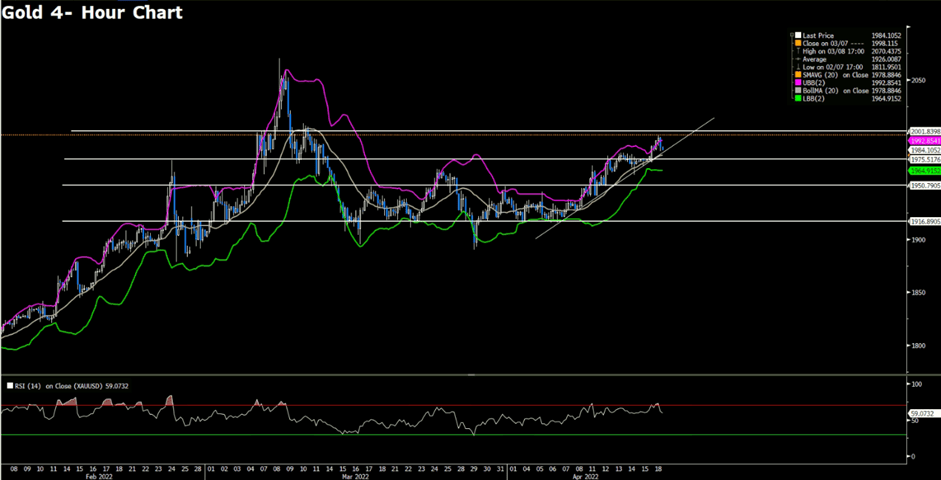
Gold extends its rally toward $1,990 per ounce, aiming for $2,000 as the US yields turn south. From the technical perspective, the bulls are in control and taking on fresh highs. The four-hour outlook of gold remains bullish as it continues to trade within the ascending trendline and above the midline of the Bollinger band. In the meantime, the 20 SMA is scaling higher, adding to the upside filter. The RSI indicator has not reached the overbought territory, which indicates a potential bullish momentum that might continue to go forward.
Resistance: 2001
Support: 1975, 1950, 1916
EURUSD (4-Hour Chart)

EURUSD is back under pressure as the US dollar advances to the highest in two years. From the technical aspect, EURUSD’s intraday bias remains downside and under pressure as the price trades below the 20 and 50 SMAs and trades within the lower bounce of the Bollinger band. The bearish momentum is now heading toward the immediate support level at 1.0758; failure to defend the level will lead EURUSD further south, accelerating its downside pressure. The near-term outlook of the EURUSD also exposes the bearish picture; the RSI indicator hovers near 40, suggesting an absence of buyers. The MACD continues to signal within the negative territory, lending supports to bears.
Resistance: 1.0932, 1.1039, 1.1126
Support: 1.0758
Economic Data
| Currency | Data | Time (GMT + 8) | Forecast |
| CNY | PBoC Loan Prime Rate | 09:15 | N/A |
| CAD | Core CPI (MoM) (Mar) | 20:30 | N/A |
| USD | Existing Home Sales (Mar) | 22:00 | 5.8M |
| USD | Crude Oil Inventories | 22:30 | 0.863M |

Situs ini menggunakan cookie untuk memberimu pengalaman pengguna yang luar biasa.
Dengan menggunakan vtmindo.com, kamu menerima kebijakan cookie kami.


![]()
Follow us on:


![]()