Market Focus
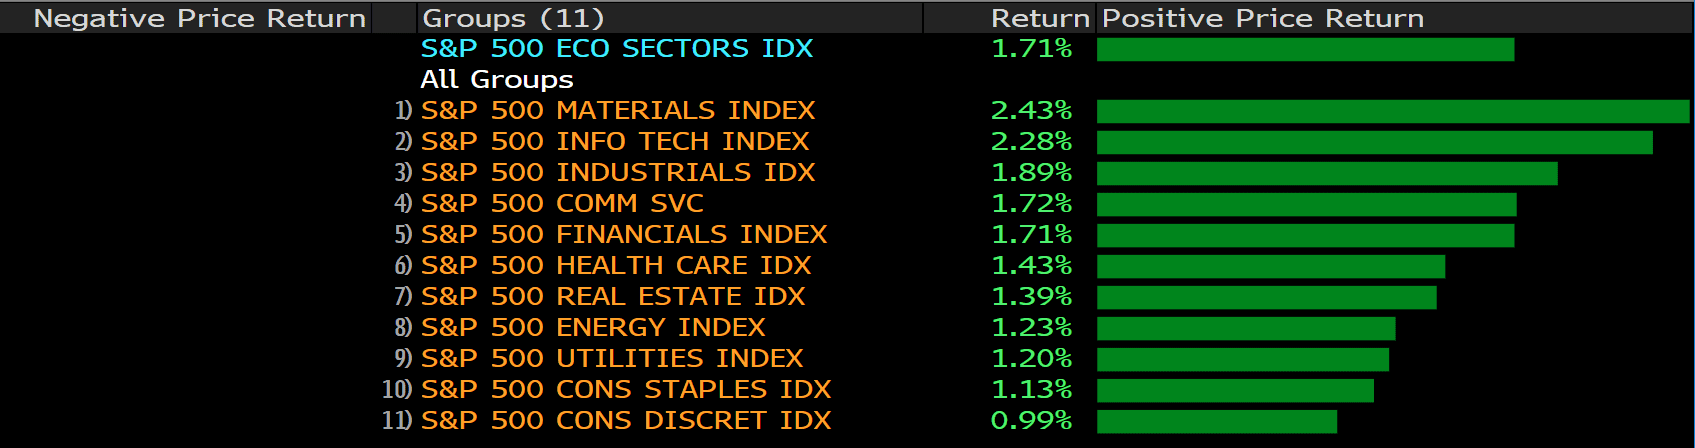
The U.S. equity market enjoyed a broad based gain on Thursday’s trading. The S&P 500 gained 1.7% to close at 4438.26, the DJIA gained 1.6% to close at 34912.56, and the Nasdaq gained 1.7% to close at 14823.43. Stocks were boosted by healthy corporate earnings and better than anticipated economic data. Goldman Sachs, BB&T, and PNC Financial services Group will release their earnings on the 15th. Morgan Stanley topped expectations for Q3 and beat earnings estimates; furthermore, Morgan Stanley reported a 25% jump in net income year over year, despite a slowdown in fixed income trading revenue.
The U.S 10-year treasury yield continued to decline and the benchmark is currently sitting at 1.519, down 1.94% from the previous trading day.
The U.S. initial jobless claims data for the week ended October 9th dropped to a fresh pandemic low of 293,000, the lowerst in 19 months. Importantly, labor demand seems to be on the rise as more people are coming off state unemployment rolls.
The Brent Crude spiked above $80 dollars a barrel and is currently settling at $84.31 per barrel; meanwhile, the WTI has also broken the $80 barrier to settle at $81.67 per barrel.
Main Pairs Movement:
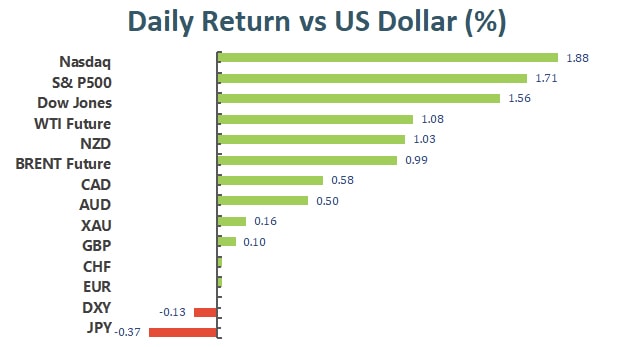
As Treasury yields held at the lower end of the weekly range, the dollar remained weak. The yield on the 10-year US Treasury note bottomed at 1.507%, ending the day nearby. The greenback managed to post a modest intraday advance against the JPY but lost to most of its major rivals.
Upbeat US data provided additional support to the market’s mood. The September Producer Price Index was up 0.5% MoM and 8.6% YoY, higher than the August readings though below the market’s expectations, while Initial Jobless Claims for the week ended October 8 printed at 293k, much better than the 319k expected.
EUR/USD lost the 1.1600 threshold, ending the day a few pips below the level. GBP/USD settled at 1.3670, while commodity-linked currencies were the best performers. AUD/USD regained the 0.7400 mark, while USD/CAD fell to 1.2355, a fresh low since the early July.
Crude oil prices were up. The International Energy Agency said that record-breaking natural gas prices would boost demand for oil, and top oil producer Saudi Arabia dismissed calls for additional OPEC+ supply. WTI settled at $81.40 a barrel, while Brent traded over $84.00. Gold flirted with $1,800 per ounce, and hovering below that level at the moment.
Technical Analysis:
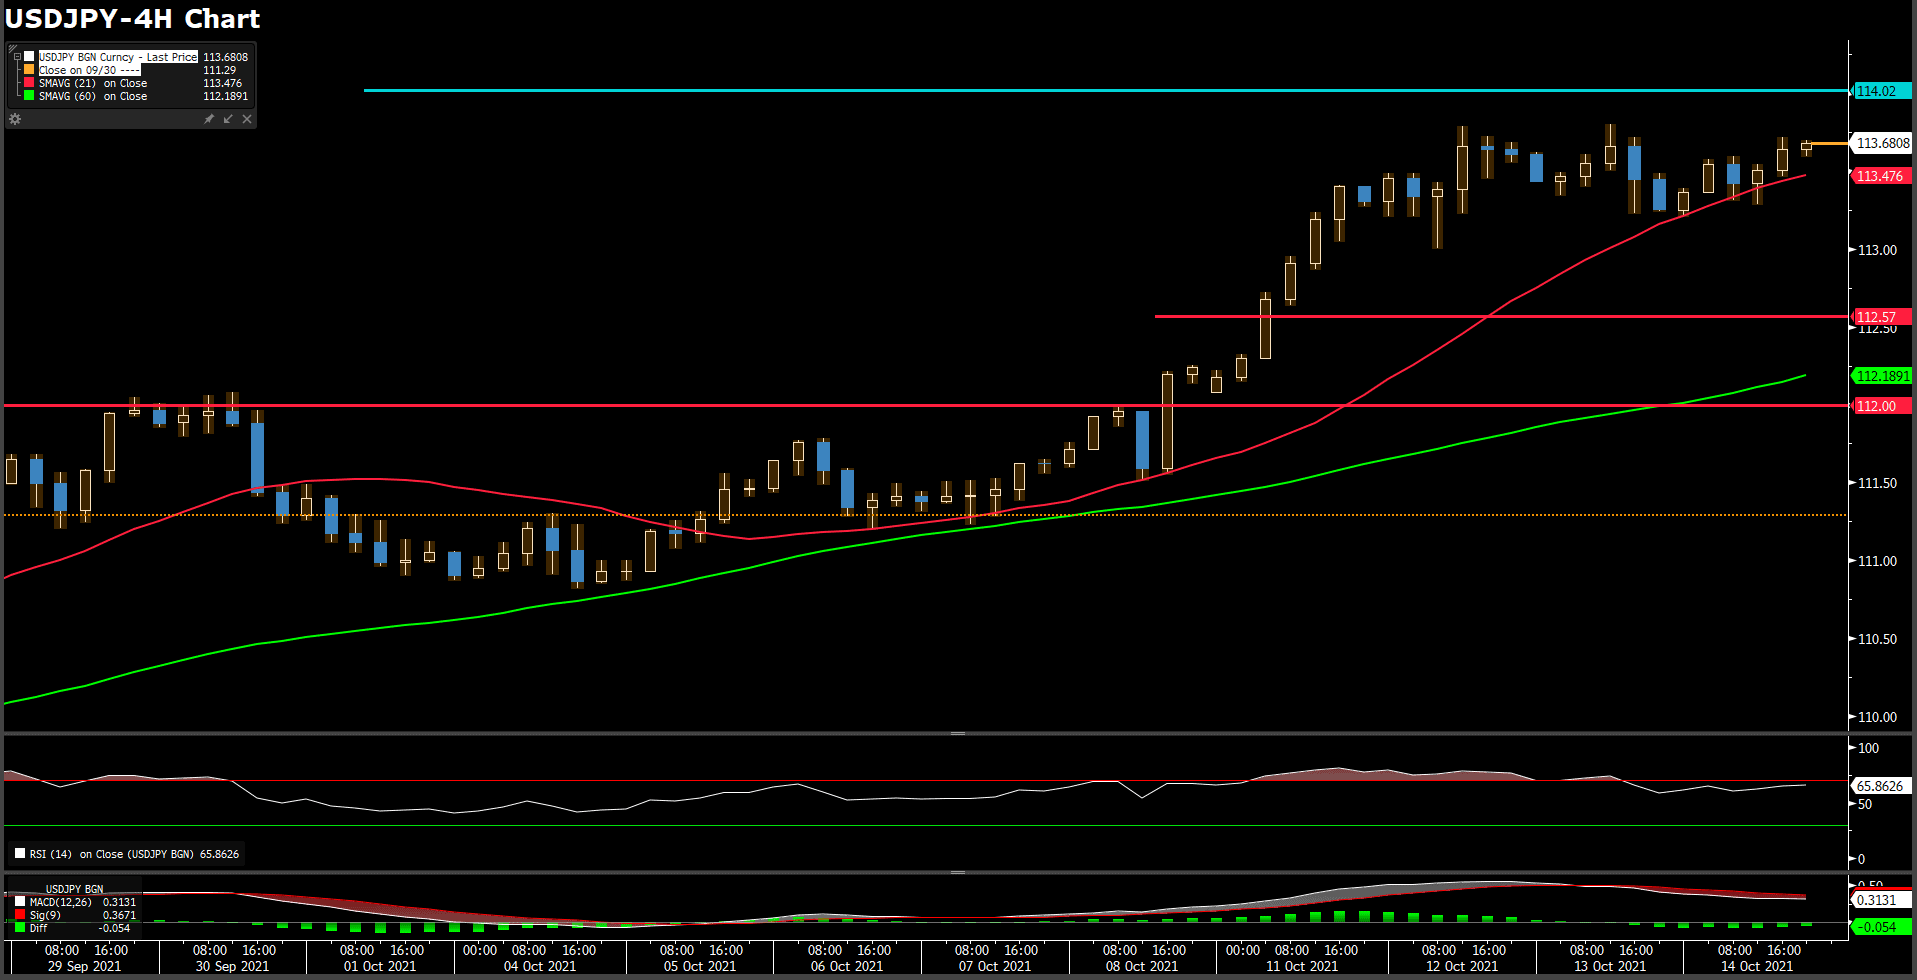
US dollar’s bullish attempt seen on the early US trading session has chanllenged resistance again at the 113.70 area, and the pair retreated to the mid-range of 113.00. The USD remains strong against a weaker yen, trading right below three-year highs at 113.80 following a 4% rally over the last four weeks.
The Japanese yen is trading lower against its main peers with a positive market sentiment hurting safe-havens in favor of riskier assets. The world’s major stock indexes are posting significant gains on Thursday, as concerns about surging inflation and supply chain bottlenecks have taken a backseat.
In a bigger picture, the pair remains steady near recent highs, and a further rally is anticipated, even though overbought shorter-term conditions could lead to a couple of days of consolidation first. The next resistance is at 114.02, and the USD strength is deemed intact as long as it does not drop below 112.00
Resistance: 114.02, 114.55
Support: 112.57, 112.00, 109.15
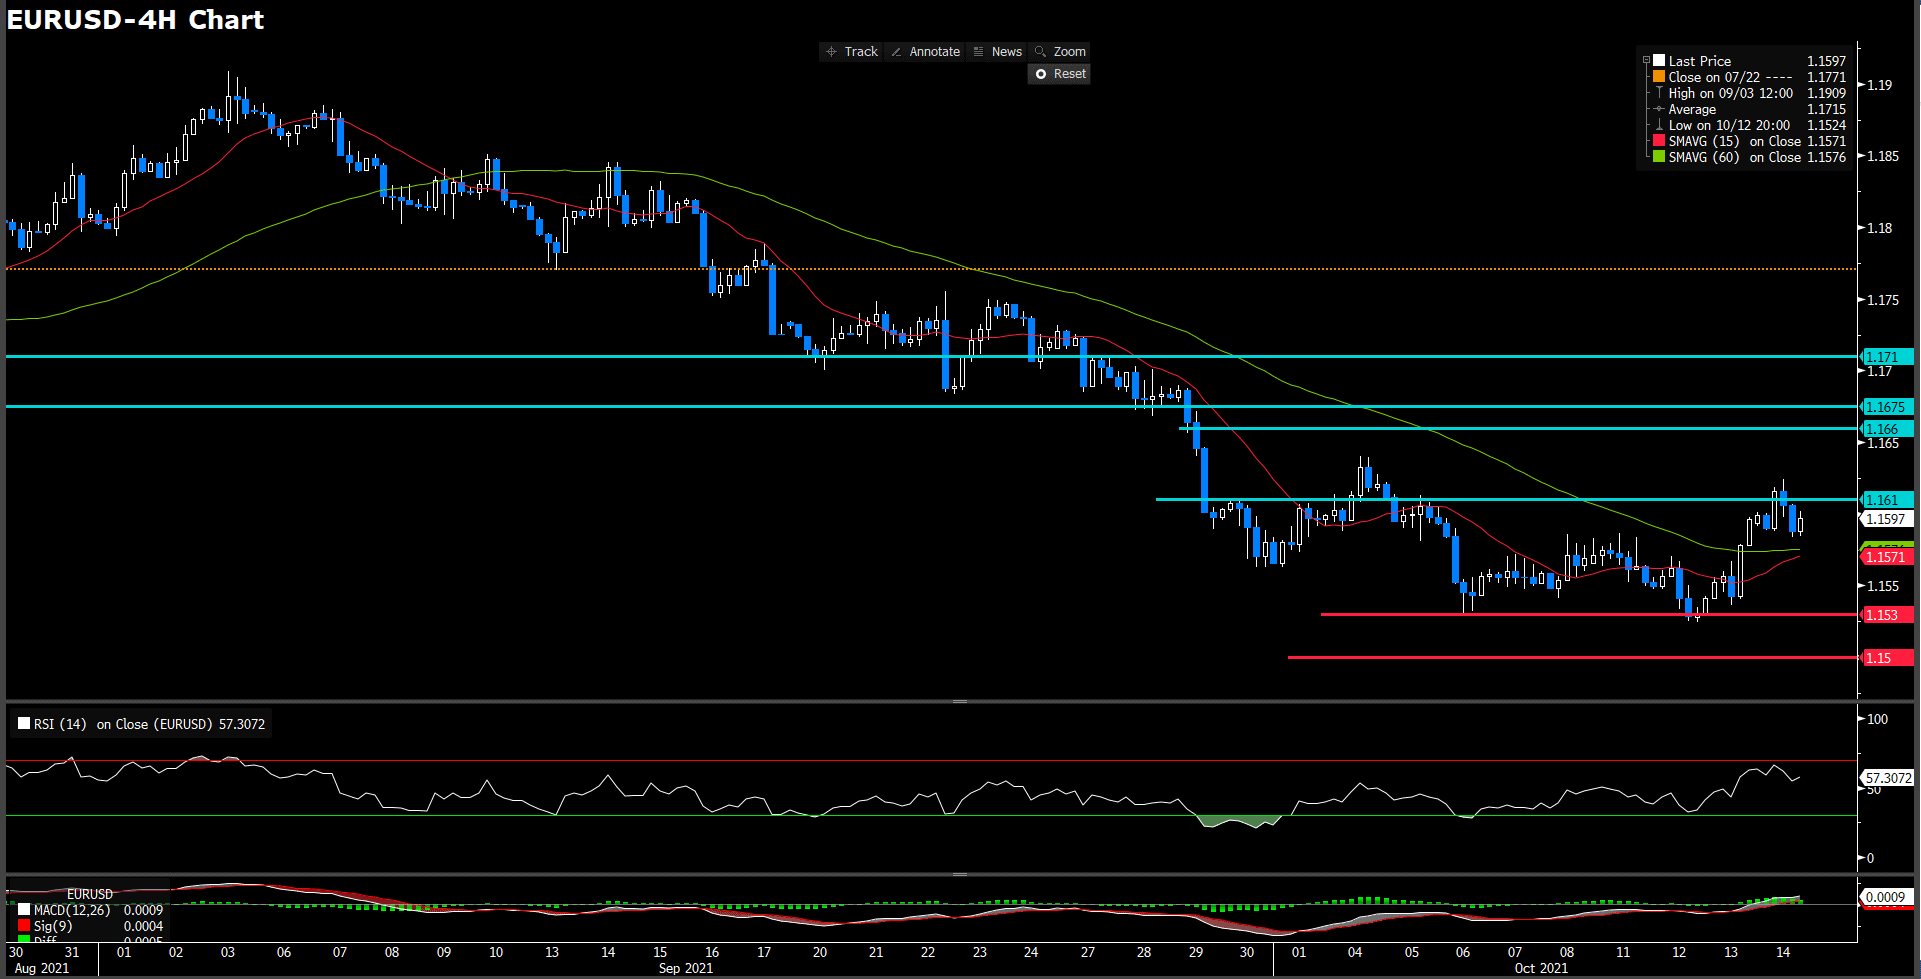
The euro fiber retreat from daily high and lost the 1.16 threshold, ending the day a few pips below the level where trading at 1.1588 with 0.04% down as of writing. Earlier in the Asian session, the currency rose to a fresh weekly high at 1.1624. Upbeat U.S. data provided additional support to the market’s mood. The Sept Producer Price Index was up 0.5% MoM and 8.6% YoY, higher than the Aug readings although below the market’s expectations, while Initial Jobless Claims for the week ended Oct 8 printed at 293K much better than earlier expected.
On technical side, the RSI index has reversed from daily high at thereabout over bought threshold, suggesting a slightly bullish movement in short term. On moving average aspect, 15-long indicator has turned it slope to positive way and 60-long became a flat movement after day market.
All of all, both critical indicator are suggesting euro could heading to upward momentum, of course base on indicator. Moreover, if 15-and 60-long MA indicator could gold cross in further that would provide a profound guidance. However, we foresee 1.16 thereabout is a main resistance as neckline of W pattern. If euro fiber could penetrate immediately resistance solid, then expect it could heading to higher stage.
Resistance: 1.161, 1.166, 1.1675, 1.171
Support: 1.153, 1.15
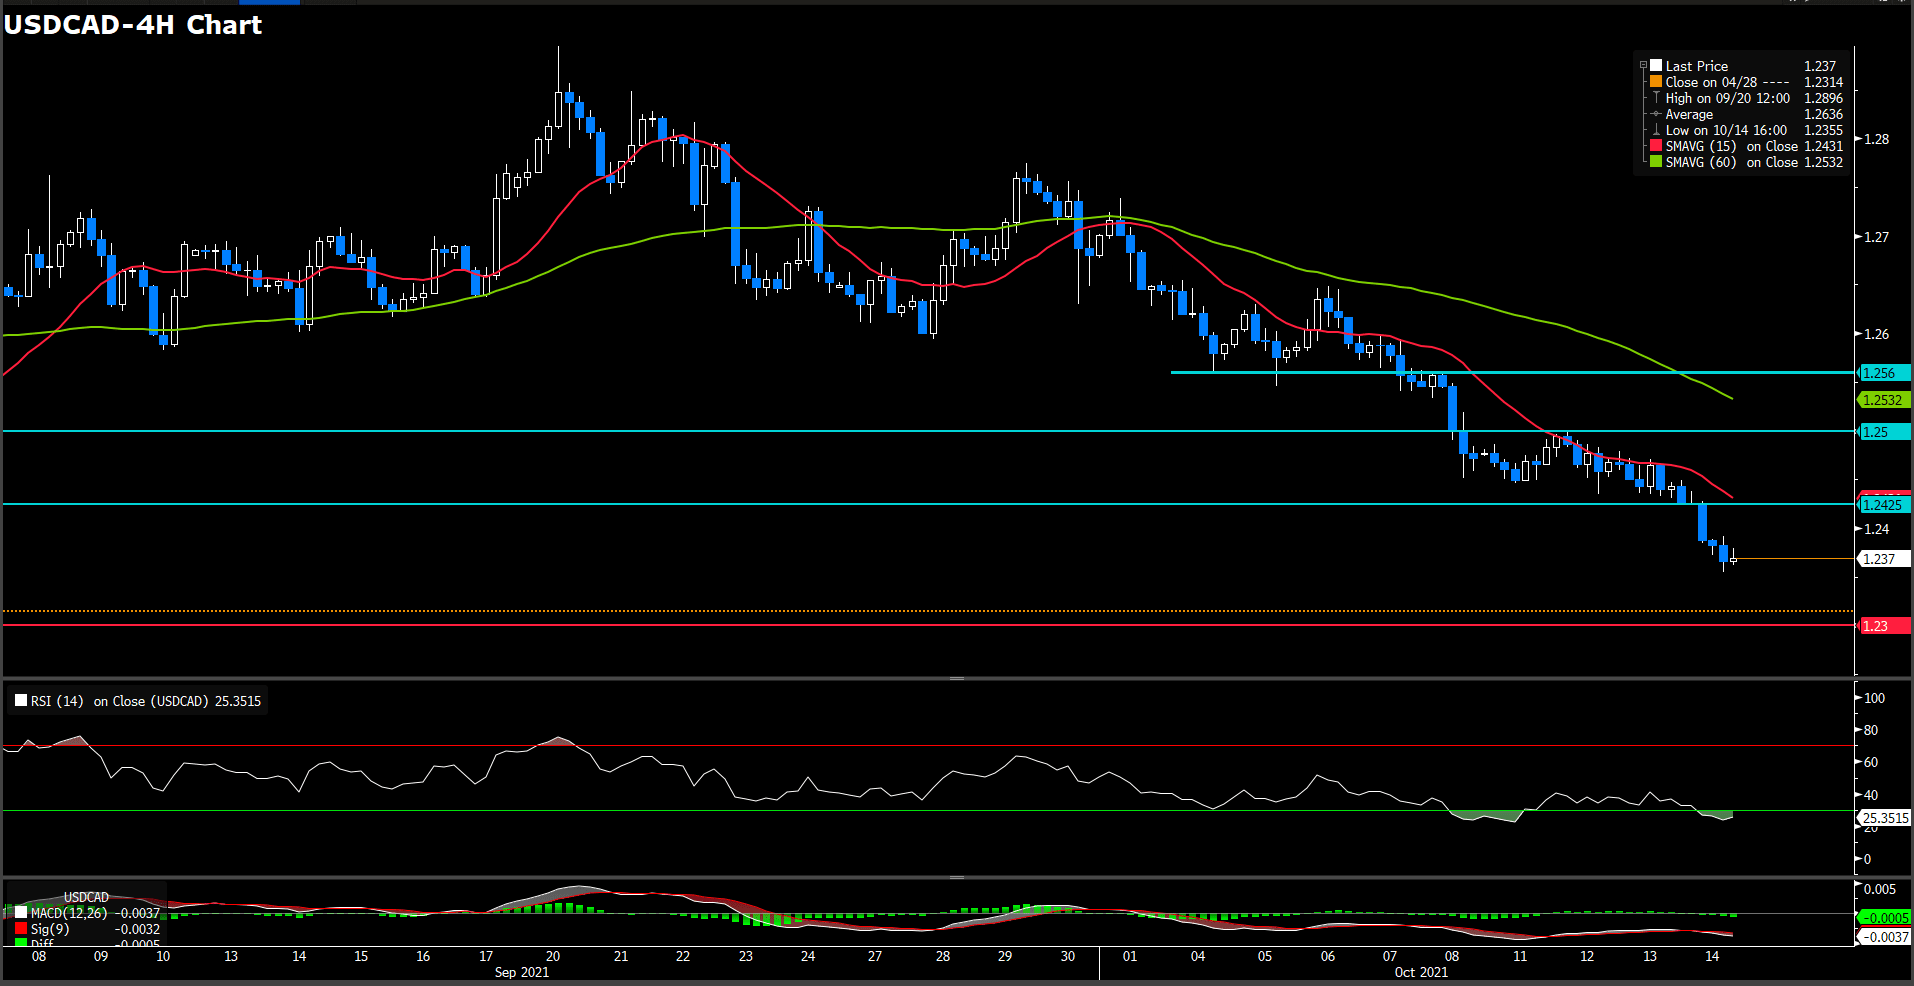
USDCAD (4 Hour Chart)
Loonie is trading at 1.237 and down over 0.57% after falling from a highs of 1.2445 to a low of 1.2354 on Thursday so far. Loonie has strengthened to its highest level in more than three months against its U.S. conterpart, as the energy crisis underpins the nation’s biggest exporting industry. Oil price were followed up the upward traction, the International Energy Agency said that record natural gas prices would boost demand for oil and top oil producer Saudi Arabia dismissed calls for additional OPEC+ supply. The nearly WTI contract sitting at $ 81.43 per barrel as of writing. Gold flirted with $1800 at ending the day just below the level.
From a technical perspective, RSI indicator fell into over sough territory and sitting 25, still suggesting bearish momentum in short term. On moving average indicator, 15- and 60-long indicator still retaining downside movement.
Since loonie break through a critical support at 1.24 around, we expect next pivotal support level will be 1.23. On up side, psychological level at 1.25 still a pivotal resistance for short-term, 1.256 following.
Resistance: 1.2425, 1.25, 1.256
Support: 1.23
Economic Data
|
Currency |
Data |
Time (GMT + 8) |
Forecast |
||||
|
AUD |
Employment Change (Sep) |
08:30 |
-137.5 K |
||||
|
USD |
Initial Jobless Claims |
20:30 |
319 K |
||||
|
USD |
PPI (MoM)(Sep) |
20:30 |
0.6% |
||||
|
Oil |
Crude Oil Inventories |
23:00 |
0.702 M |
||||

Situs ini menggunakan cookie untuk memberimu pengalaman pengguna yang luar biasa.
Dengan menggunakan vtmindo.com, kamu menerima kebijakan cookie kami.


![]()
Follow us on:


![]()