Daily Market Analysis
Market Focus
Volatility continued to roil risk assets, with U.S. equities notching their biggest monthly slide since March 2020.
Stocks pushed lower on Thursday even after confirmation that the House passed a nine-week spending bill to avert a U.S. government shutdown. For traders, that was just one within a litany of risks for markets. Investors are also bracing for the Federal Reserve to wind down its stimulus amid mounting fears about slowing economic growth, elevated inflation, supply-chain bottlenecks, a global energy crunch and regulatory risks emanating from China.
Political wrangling in Washington is threatening to push the U.S. into default and force President Joe Biden to scale back his spending agenda. Democratic Senator Joe Manchin wants the social spending package to cut by more than half to $1.5 trillion. House Speaker Nancy Pelosi was pressing ahead with a vote on a bipartisan infrastructure bill, even though progressive Democrats said they have the numbers to stall it until the Senate agrees on a more expansive tax and spending package.
China’s central government officials ordered the country’s top state-owned energy companies — from coal to electricity and oil — to secure supplies for this winter at all costs, according to people familiar with the matter. A severe energy crisis has gripped the country, and several regions have had to curtail power to the industrial sector, while some residential areas have even faced sudden blackouts.
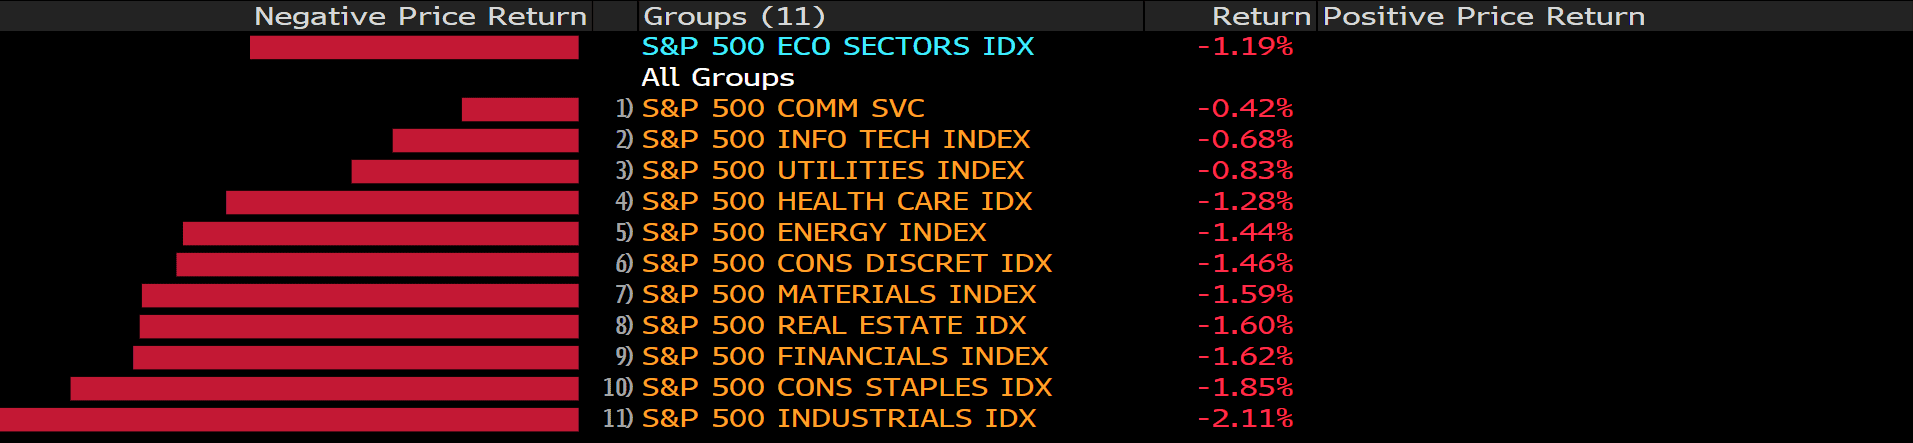
The S&P 500 closed at the lowest level since July, extending its September losses to almost 5%. Economically sensitive companies like industrials and financials were among the worst performers on Thursday. The slide almost wiped out the index’s gains for the quarter.
A near-record technical streak for the S&P 500 has some bulls worried that a sharp pullback is overdue.
Main Pairs Movement:
The broad U.S. equity markets closed the third quarter of the year on a weak note. Markets were moved by growing concerns over inflation, supply chain disruptions, rising commodity prices, and the imminent lift of pandemic era monetary assistance by global central banks. Market participants are also waiting for the U.S. congress to approve raising the debt ceiling today, in order to prevent a federal government shutdown. The U.S. initial jobless claims report returned a higher than expected number, which further indicated a slowdown of the economic recovery.
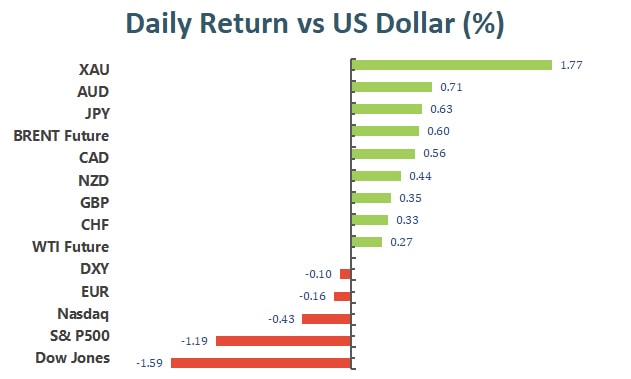
The Greenback lost steam during today’s trading, thus benefitting currency pairs against the Dollar. Cable rebounded from yesterday’s fresh low, but it still remains to be seen if the Pound can stable its recent erratic price actions. USD/JPY retreated after gaining massive ground from yesterday’s trading. Gold soared as the U.S. initial jobless claims returned lower than expected figures.
Technical Analysis:
GBPUSD (4 Hour Chart)
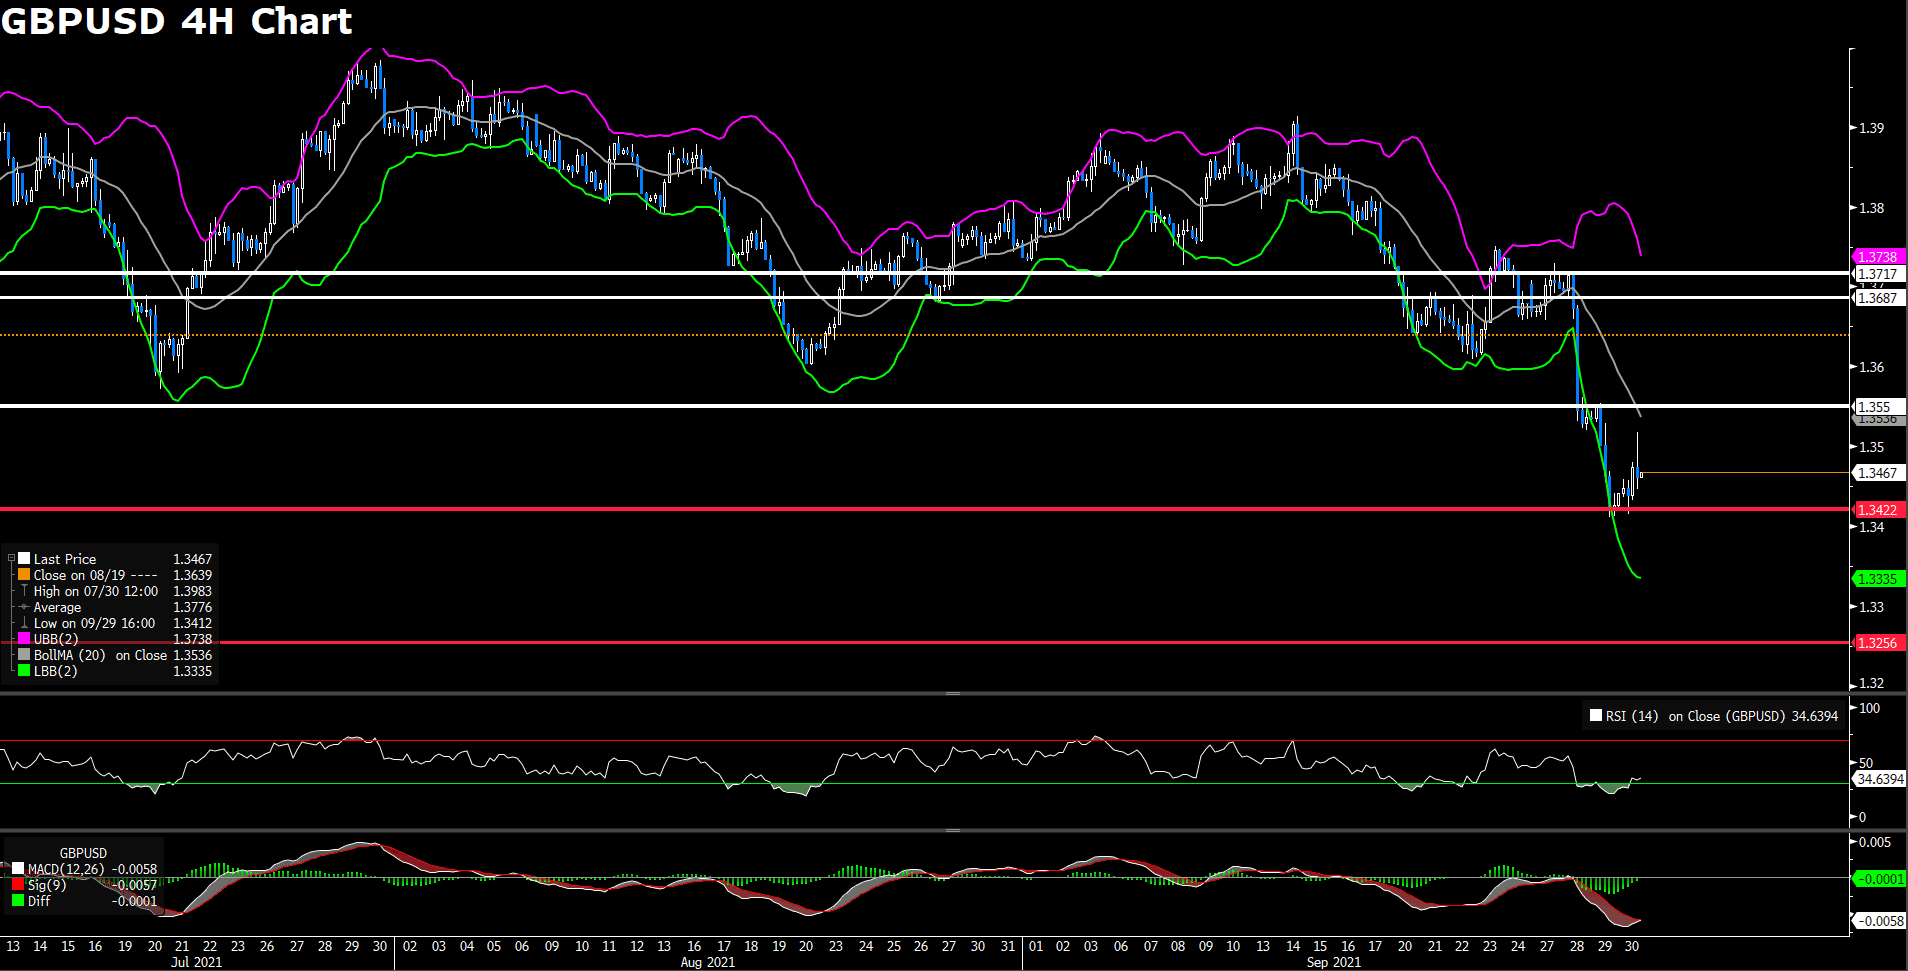
Cable was able to recover some of the losses from yesterday, as a weaker jobless claim figure hurt the Dollar’s strength. Despite today’s mild recovery, the Pound is still plagued by three major fundamental events. First, the British furlough program is set to expire on Thurday. Around 5% of the British workforce is still supported by this program, and workers will face tremendous uncertainty as the program expires. Second, recent shortage of truck drivers has brought on an unprecedent shortage of gasoline throughout the U.K.. This event has brought on a short term supply disruption that could weigh on the near term economic recovery. Third, Brexit issues still loom as U.K. and France battle over fishing rights in the English Channel.
From a technical perspective, Cable has found support around the 1.3422 price region after falling near 0.8% during yesterday’s trading. The return towards previous level will be tough for Cable as fundamental issues still plague the Pound. As of writing, RSI for Cable is sitting at 34.2, indicating some overselling in the market. Cable is trading below its 50, 100, and 200 day SMA
Resistance: 1.355, 1.3687, 1.3717
Support: 1.3422, 1.3256
USDJPY (4 Hour Chart)
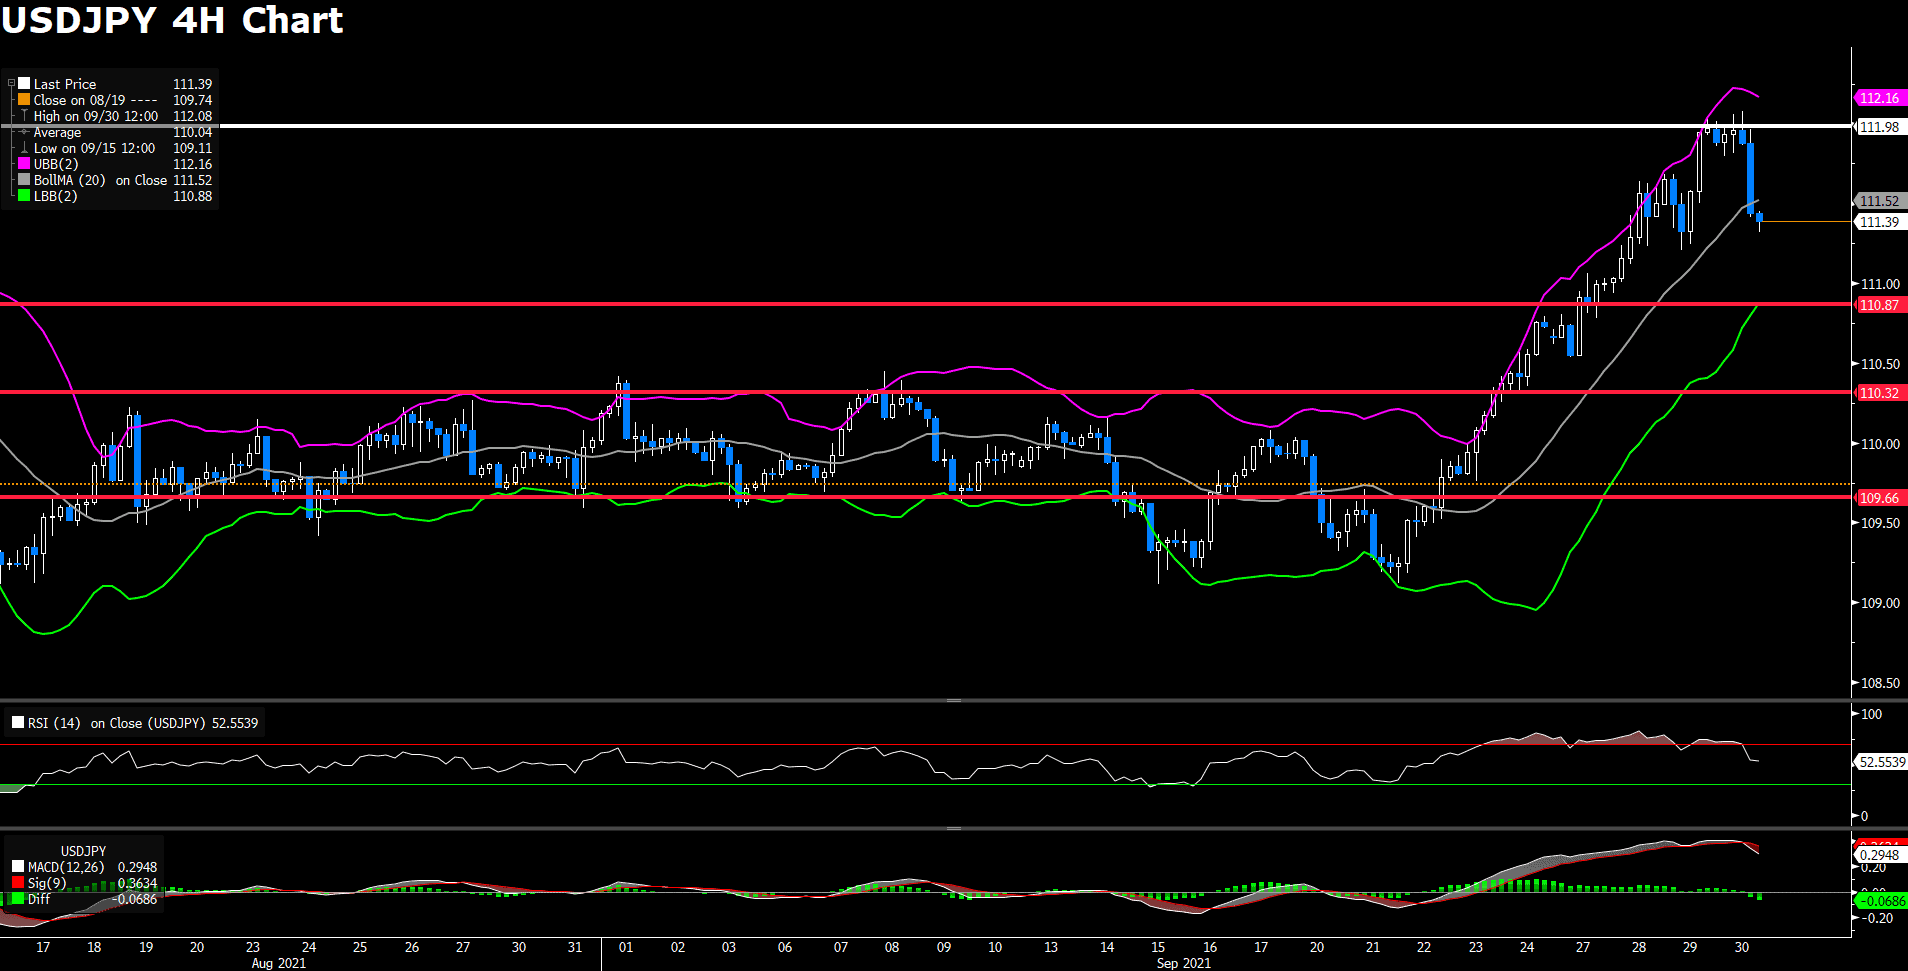
USD/JPY reversed course after gaining for six straight trading days. Momentum for the Greenback eased today; however, the short term demand for the U.S. dollar remains strong as the U.S. reported slight gains in notional GDP. Today’s price reversal could be a result of traders taking profit or market participants reacting to the weaker U.S. jobless claim figure. The fundametal side of things are still strongly in favor of the bulls.
From a technical perspective, USD/JPY hit resistance around the 111.98 price region and began its decline. However, due to the fundamental support that the Dollar enjoys, downside for USD/JPY remains limited. RSI for the pair has left over bought territory and is now settled around the 52 mark. USD/JPY is trading above the 50, 100, and 200 day SMA.
Resistance: 112
Support: 110.87, 110.32, 109.66
XAUUSD (4 Hour Chart)
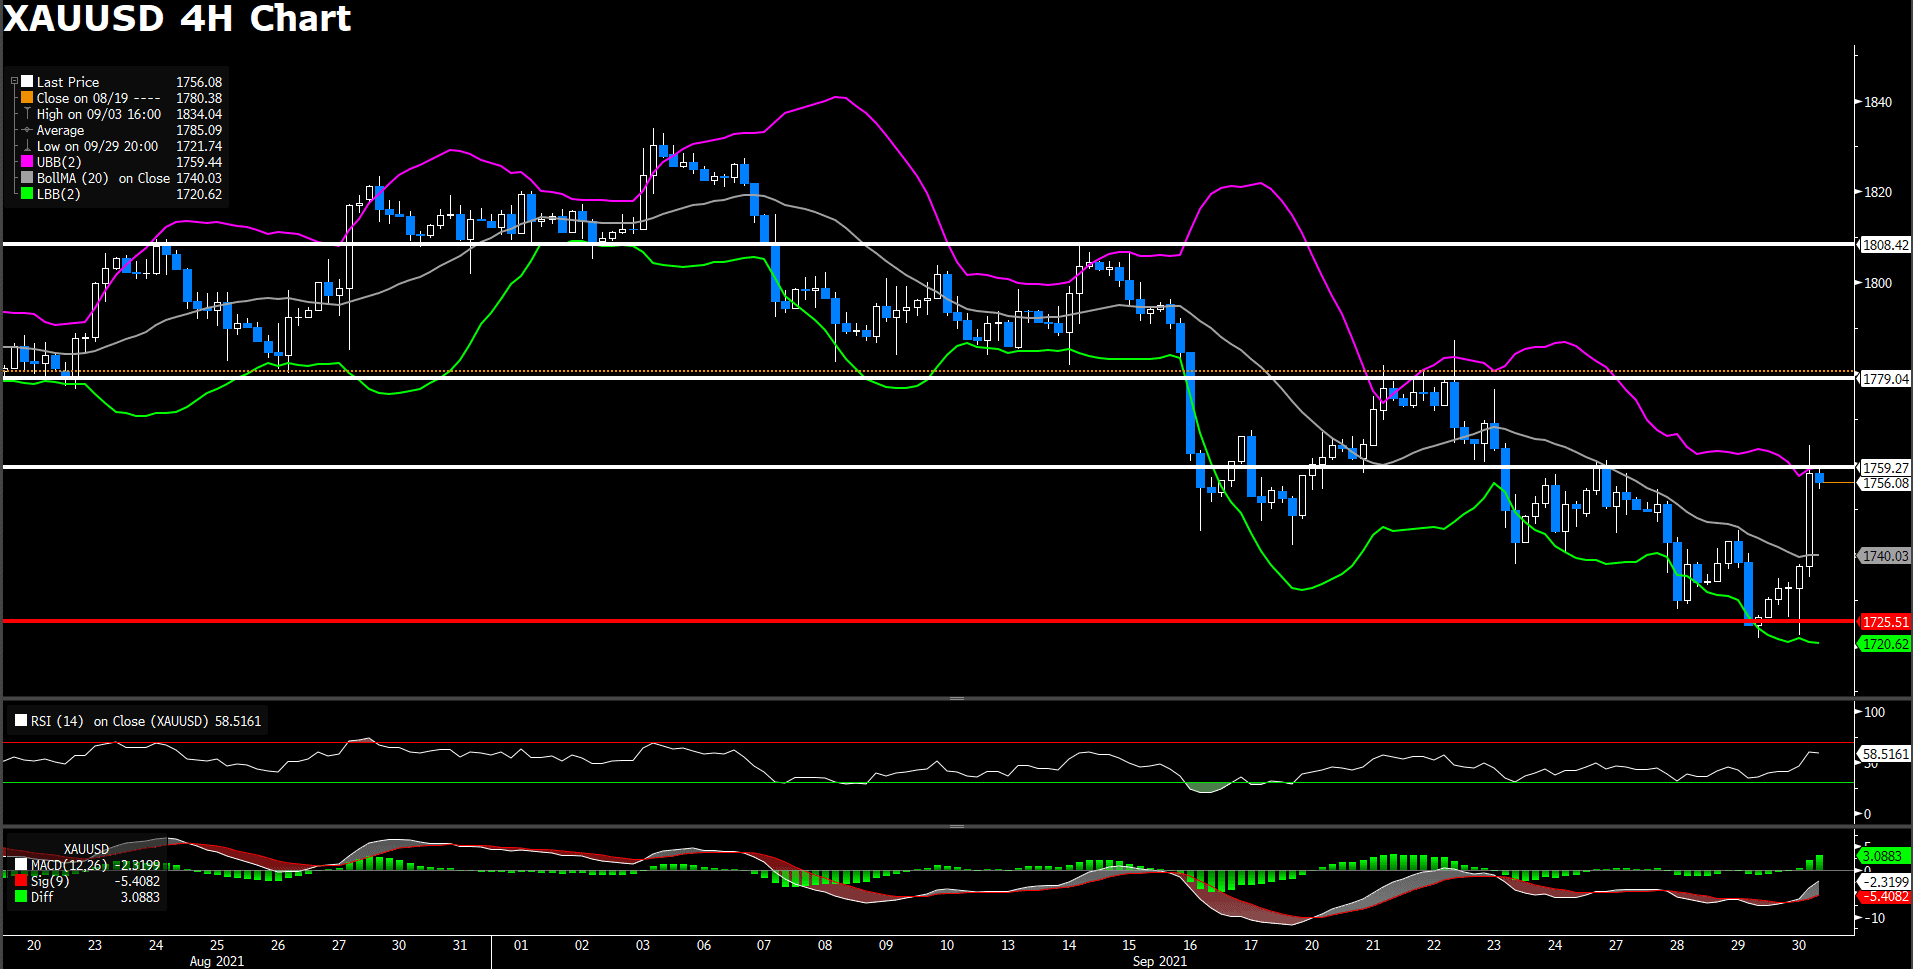
Gold advanced more than 1.5% against the Dollar as the broad U.S. equity market experiences another fierce pullback. A weak jobless claim report combined with weak gains in monthly notional GDP have both propelled Gold higher against the dollar; furthermore, the retreating U.S. 10 year bond yield also helped Gold recover from a three day slump.
From a technical perspective, XAU/USD successfully defended the 1725 support level before the end of yesterday’s trading session. During today’s trading, XAU/USD reached our estimated resistance level, around the 1759 price region, but was unable to maintain its upward momentum and the pair soon began retreating. RSI for the pair sits at 58, indicating mild over buying in the market. XAU/USD is trading above its 100 and 200 day SMA, but the pair sit below its 50 day SMA. Despite short term technical indicators showing a bullish outlook for XAU/USD, the increasing hawking tone from global central banks still pose strong downward pressure on the precious metal.
Resistance: 1759.27, 1779.04, 1808.42
Support: 1725.51
Economic Data
|
Currency |
Data |
Time (GMT + 8) |
Forecast |
||||
|
EUR |
German Manufacturing PMI (Sep) |
03:55 |
58.5 |
||||
|
GBP |
Manufacturing PMI (Sep) |
04:30 |
56.3 |
||||
|
EUR |
Core CPI (YoY) (Sep) |
05:00 |
3.3% |
||||
|
CAD |
GDP (MoM) (July) |
08:30 |
-0.2% |
||||
|
USD |
ISM Manufacturing PMI (Sep) |
10:00 |
59.6 |
||||
|
USD |
Michigan Consumer Sentiment (Sep) |
10:00 |
71 |
||||

Situs ini menggunakan cookie untuk memberimu pengalaman pengguna yang luar biasa.
Dengan menggunakan vtmindo.com, kamu menerima kebijakan cookie kami.


![]()
Follow us on:


![]()