Daily Market Analysis
Market Focus
Megacap companies rallied to an all-time high as traders turned to defensive shares after the latest round of economic data suggested a slowdown in the labor-market recovery.
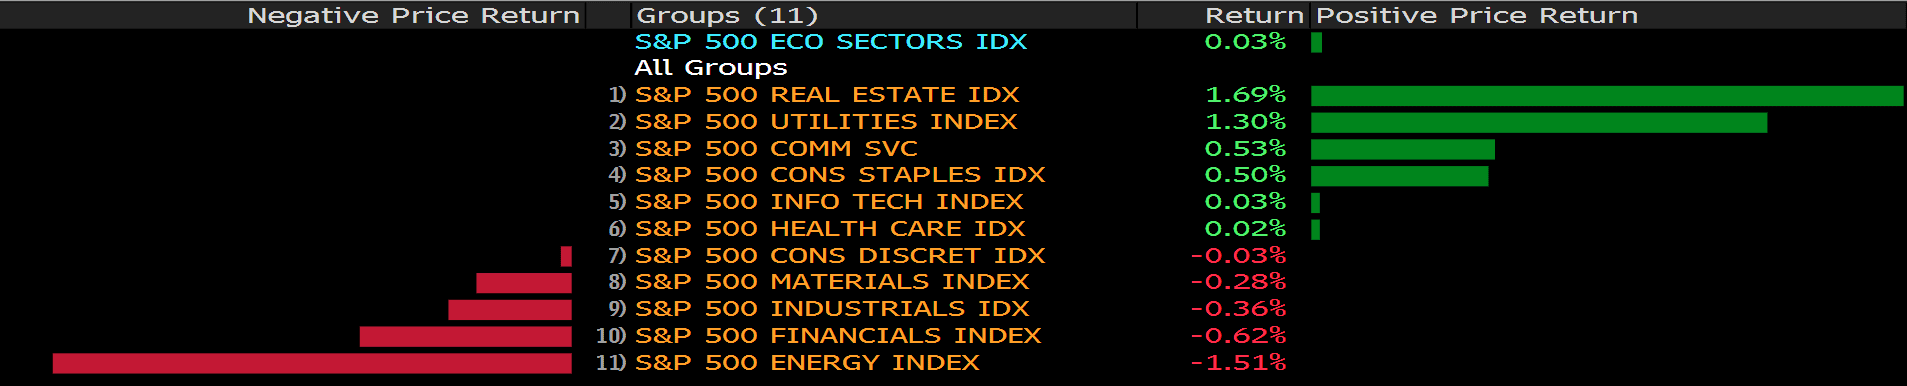
The NYSE FANG+ Index of pandemic darlings such as Apple Inc. and Amazon.com Inc. climbed about 1.5%. Tech, utilities and real-estate firms in the S&P 500 advanced, while energy and financial stocks fell. The benchmark gauge of American equities pared gains in afternoon trading, while still heading toward another record. The Dow Jones Industrial Average was little changed.
U.S. companies added fewer jobs than expected in August, ADP Research Institute data showed. While manufacturing expanded at a stronger-than-estimated pace, supply-chain bottlenecks were accompanied by labor constraints. Those figures came before Friday’s payrolls data, with economists expecting a deceleration from the rapid gain in the prior month and a drop in the unemployment rate.
Meantime, Citigroup Inc.’s Tobias Levkovich is sticking to his bearish call. The bank’s chief U.S. equity strategist predicts the index will end the year at 4,000 before reaching 4,350 by June 2022. Both levels sit below its last close of 4,522.68. Underpinning his view are stretched valuations and a planned tax rise that will hurt corporate profits.
Chinese stocks listed in the U.S. are gaining for a third consecutive day as investor sentiment begins to recover after a selloff fueled by Beijing’s sweeping regulatory crackdown.
Main Pairs Movement:
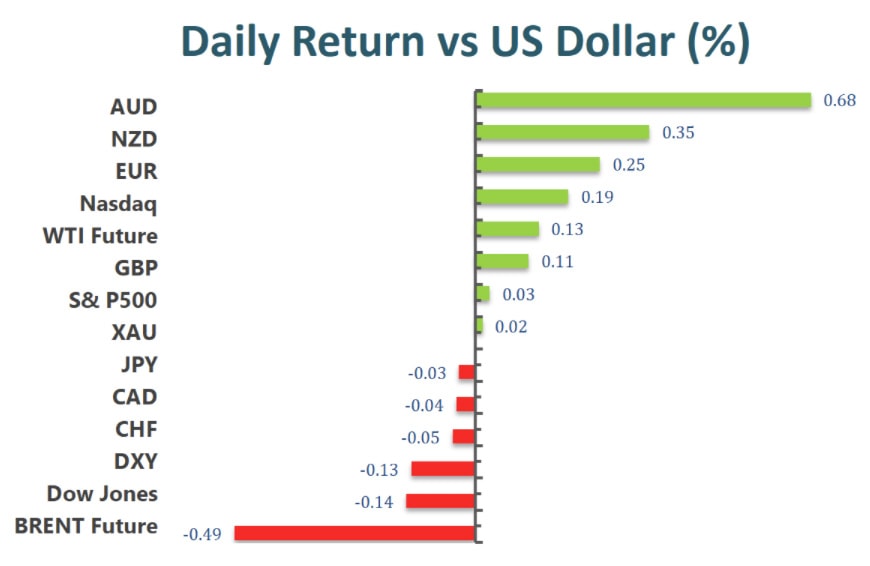
The Dollar greenback weakened amid downbeat ADP report, with the dollar index down 0.14% on Wednesday. The ADP private payrolls increased by 374,000 in August, missing expectation of 613,000 by large margin. Though ISM Manufacturing PMI came on top of expectation, printed 59.9 compared to forecasted 58.6, but employment figures remain to be the main focus for both Federal Reserve and market watchers. A big miss on Friday NFP report could significantly hamper Fed’s mood to initial taper in October, while a mild deviation from expectation could set the stage for stronger dollar in the fourth quarter.
Aussie was the best performer among its G-7 peers, gained 0.7% on the day. The pair is extending its rally towards 0.74, and conquered multiple resistance line along the way. The second quarter GDP (QoQ) was 0.7%, beating anticipated 0.5%. This upbeat data added to Aussie strength against the US dollar on Wednesday. However, the recent leg higher is a corrective move and we expect upward momentum to recede during next week.
Oil prices slipped after Russian oil minister Alexander Novak said Russian companies are ready to boost production beyond current levels, which was set by OPEC+. The Brent Futures was down 0.49%.
Technical Analysis:
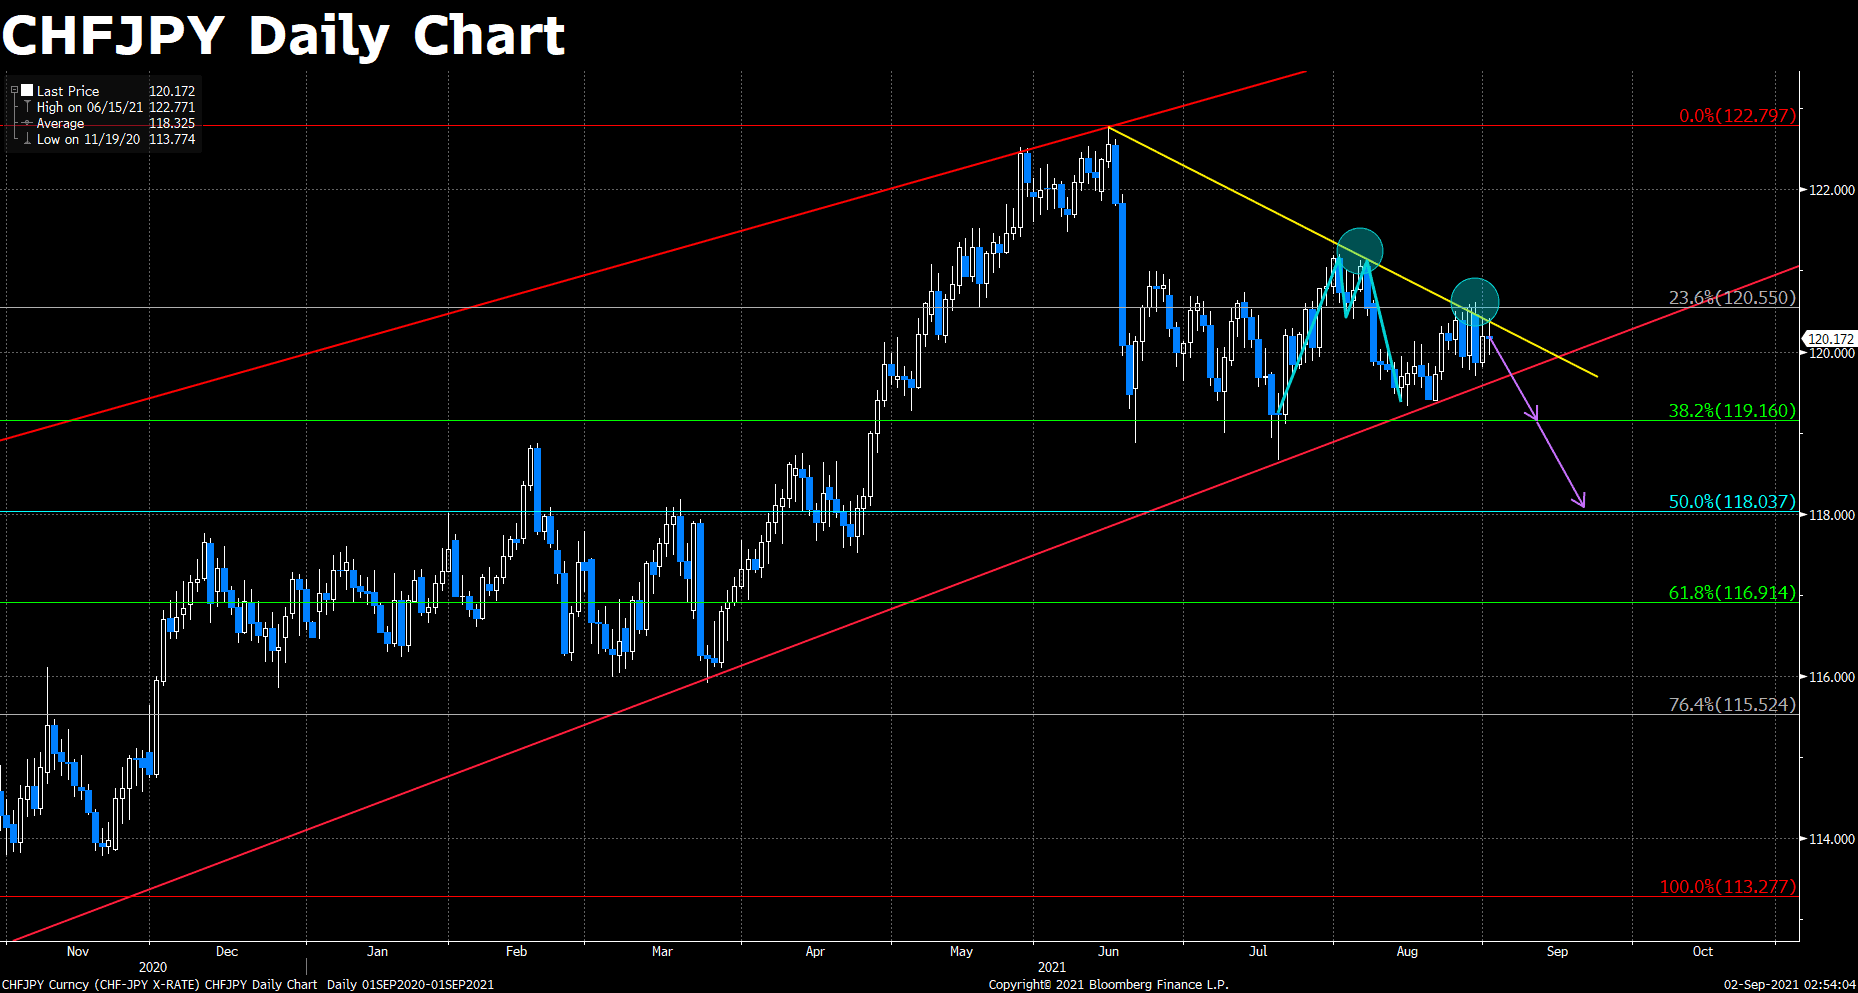
CHFJPY (Daily Chart)
CHFJPY is approaching the lower part of a big ascending tunnel, and threatened for a breakout to the downside. Prices have been choppy in the past few sessions as a smaller descending trendline is capping further upward movements.
There was a obvious double-top pattern highlighted in blue, and price is now coming back to retest the neckline. We’ve seen strong rejection on Monday, which engulfed the entirety of previous candle, and signals upcoming bearish moves.
To the downside, bears will have to settle a solid close beneath the ascending trendline in order to attract more sell volume. A horizontal support of 119.2 is not far from the pivotal point near 119.7. Further in the south, 50% Fibonacci of 118 handle could provide some support.
Resistance: 120.55, 122.8
Support: 119.2, 118, 116.9
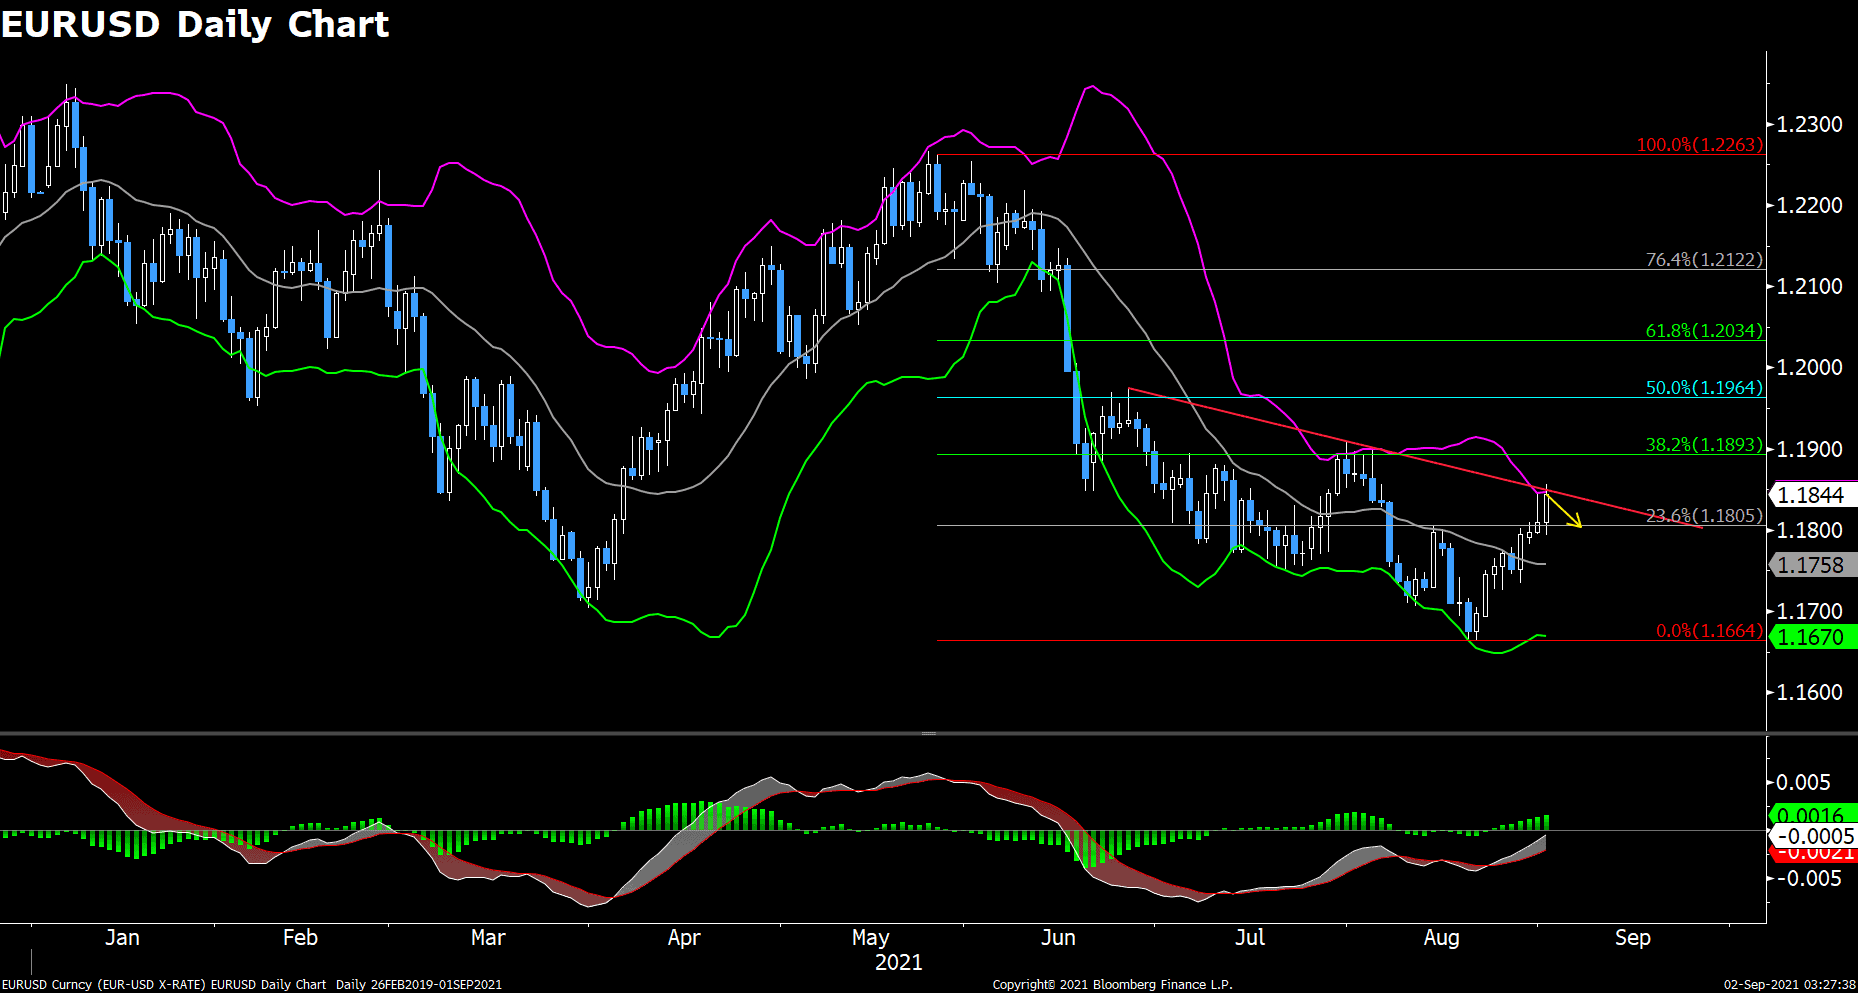
EURUSD (Daily Chart)
Euro dollar has recovered most of losses in July. However this pair failed to overcome a downward trendline on Wednesday as selling bias remains robust for the sharerd currency.
Price traveled from the bottom of Bollinger Band all-the-way to the upper bound within few days, and there was not much frictions. We suspect the latest rally to be bears’ profit-taking, rather than a reversal. That being said, we could at least see move lower toward 23.6% Fibonacci of 1.18 in the next day or so.
Investors should be prudent to wait for Friday’s Non-Farm Payroll release to determine a much clear direction. On the upside, modest resistance sits around 1.19, next to 1.196. Conversely, bulls’ defense line would be around 1.18 and 1.166.
Resistance: 1.19, 1.196, 1.2
Support: 1.18, 1.166
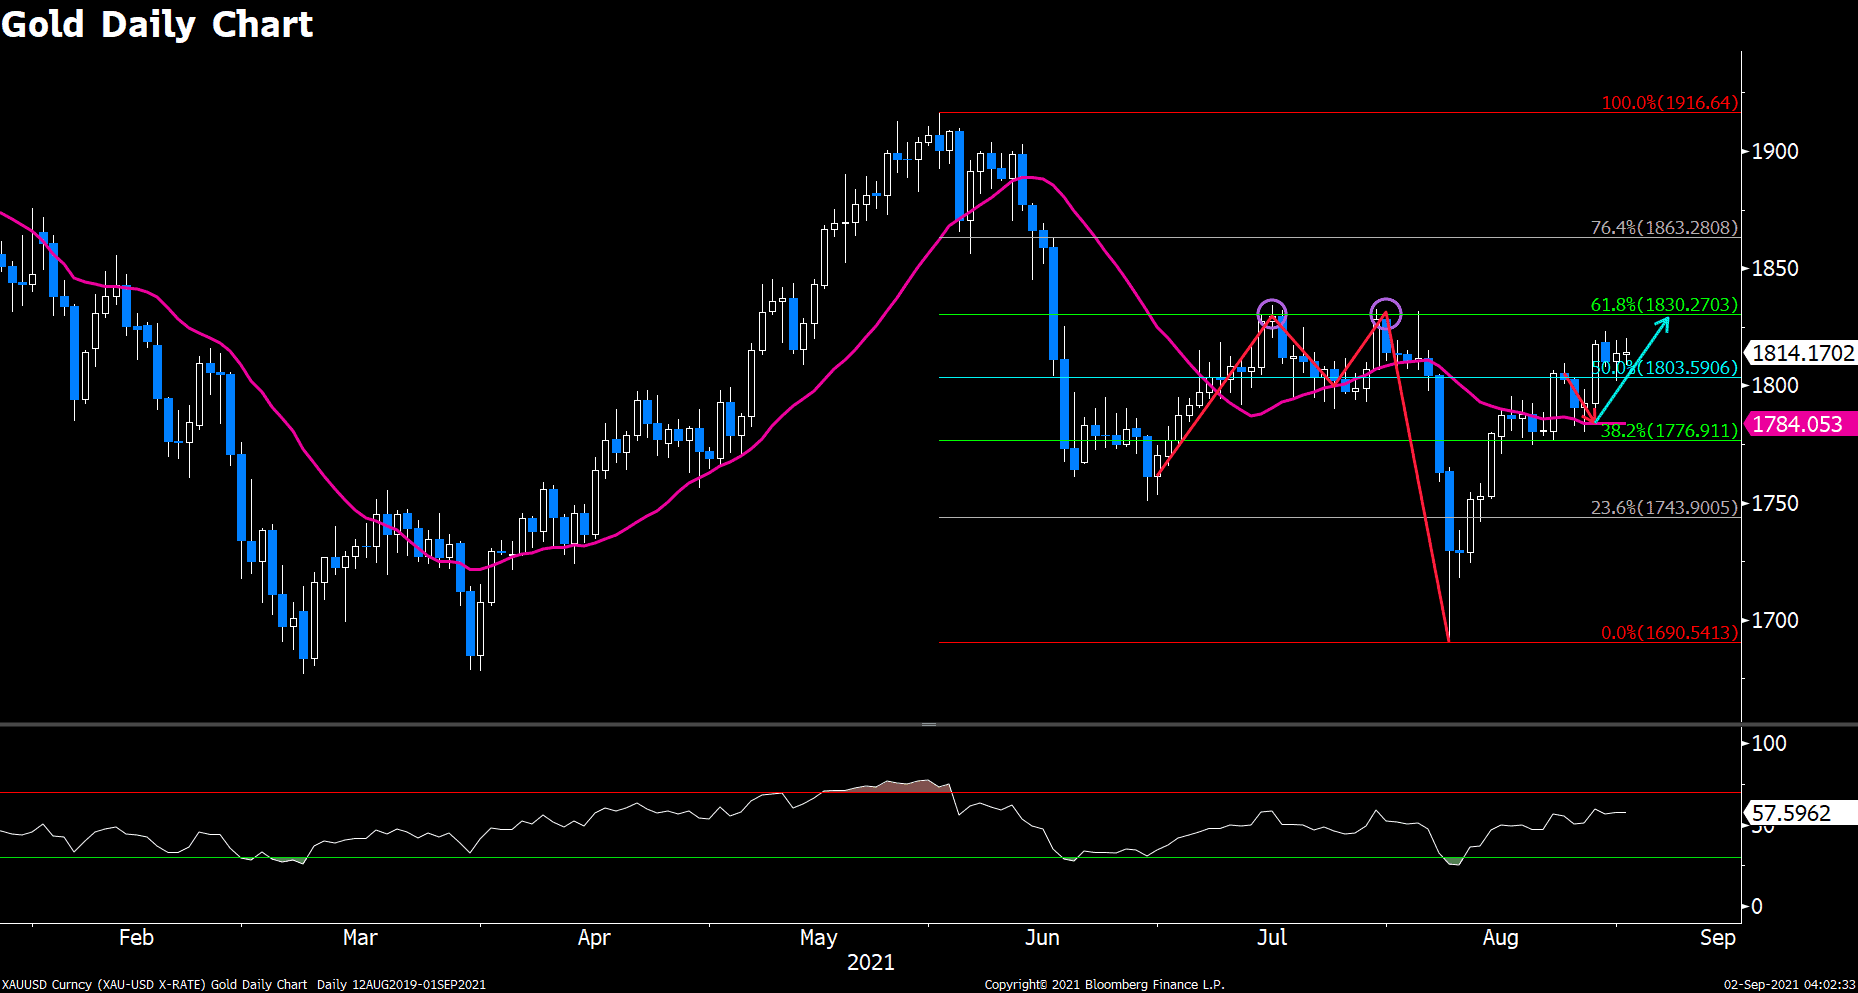
XAUUSD (Daily Chart)
The picture for Gold was little changed as market participants are eyeing for Friday NFP report for fresh trading incentives. Price has overcame DMA20, and retraced to validate the breakout was solid. Yesterday’s attempt to break below $1800 was defended by 50% Fibonacci of $1804.
Looking at a broader picture, the precious metal previously underwent a double-top pattern. Price took a dive straight to $1690 after the neckline of the double-top was defeated. Normally, if price comes back to retest the neckline, it will meet abundant pressure around this level.
The fact that current trade pattern failed to fulfill this thesis suggests short positions have been overwhelmed by longs. Therefore, we do not expect to see a significant pullback in the near term. That being said, price looks to advance further into 61.8% Fibonacci resistance around $1830.
Resistance: 1830, 1863, 1917
Support: 1804, 1777, 1744
Economic Data
|
Currency |
Data |
Time (GMT + 8) |
Forecast |
||||
|
AUD |
GDP (QoQ) (Q2) |
09:30 |
0.5% |
||||
|
CNY |
Caixin Manufacturing PMI (Aug) |
09:45 |
50.2 |
||||
|
EUR |
German Manufacturing PMI (Aug) |
15:55 |
62.7 |
||||
|
GBP |
Manufacturing PMI (Aug) |
16:30 |
60.1 |
||||
|
USD |
ADP Nonfarm Employment Change (Aug) |
20:15 |
613K |
||||
|
USD |
ISM Manufacturing PMI (Aug) |
22:00 |
58.6 |
||||
|
USD |
Crude Oil Inventories |
22:30 |
-3.088M |
||||

Situs ini menggunakan cookie untuk memberimu pengalaman pengguna yang luar biasa.
Dengan menggunakan vtmindo.com, kamu menerima kebijakan cookie kami.


![]()
Follow us on:


![]()