Daily Market Analysis
Market Focus
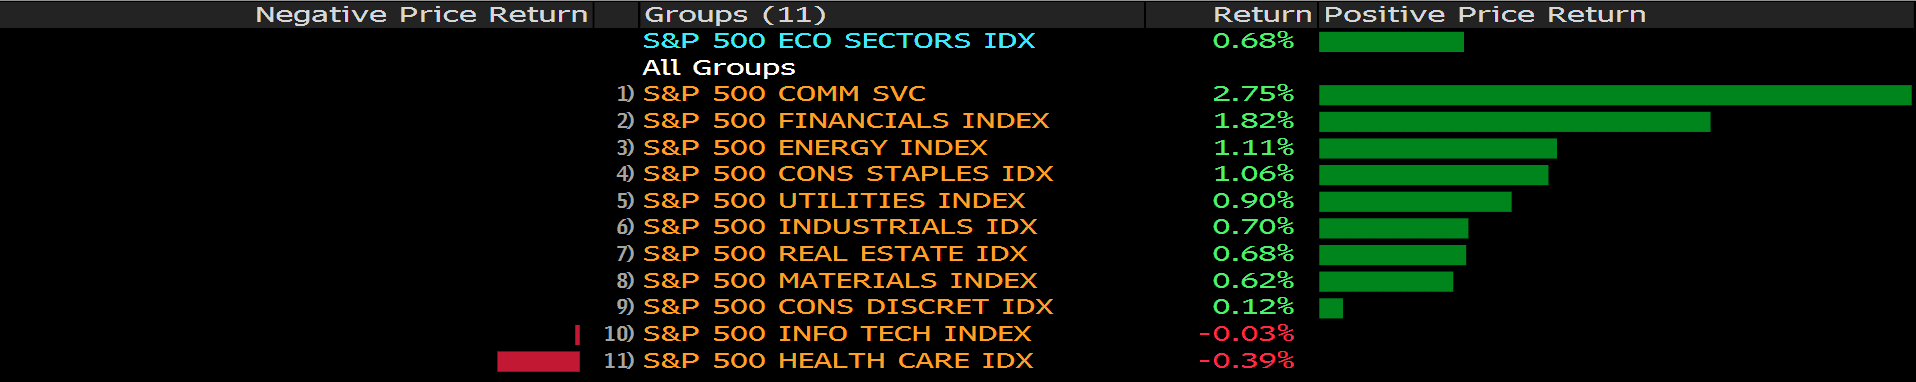
U.S. stocks rose to a record as investors digested the latest batch of corporate earnings and data that showed the American economy gained steam in the first three months of the year.
Amazon.com climbed after hours on a better-than-estimated revenue forecast, while Twitter sank amid a lackluster outlook. In regular trading, Apple wiped out its gains on concern that the iPhone maker may not sustain growth after a blockbuster quarter as it faces a tightening supply of chips.
The tech-heavy Nasdaq 100 broke a two-day losing streak. The volatility came as investors continued to assess major corporate results that overshadowed signs of a resurgence in the economy. Data released Thursday showed U.S. gross domestic product expanded at a 6.4% annualized rate in the first quarter, while applications for U.S. state unemployment insurance fell last week to a fresh pandemic low.
While the GDP figures may support the Federal Reserve’s strong assessment of the economy, the central bank is in no mood to halt aggressive support as it looks for even further progress in employment and inflation. Chair Jerome Powell on Wednesday dismissed worries about price surges or anecdotes of labor shortage, implying policy makers are prepared to run the economy hot for a while. President Joe Biden unveiled a $1.8 trillion spending plan targeted at American families, adding to the economic optimism.
With their plans, the Fed and Biden have delivered a boost to investor sentiment that has see-sawed in recent days between optimism over a string of robust economic data and caution amid high valuations and speculation about stimulus tapering by year-end.
Main Pairs Movement:
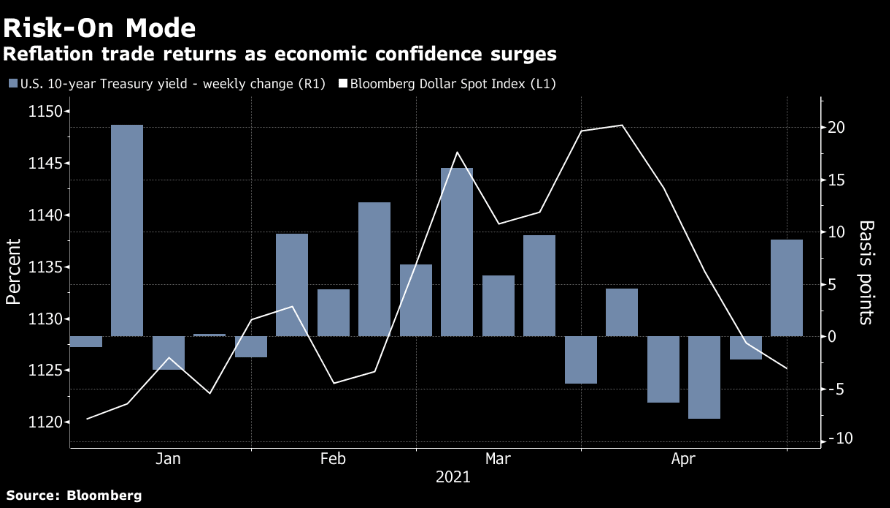
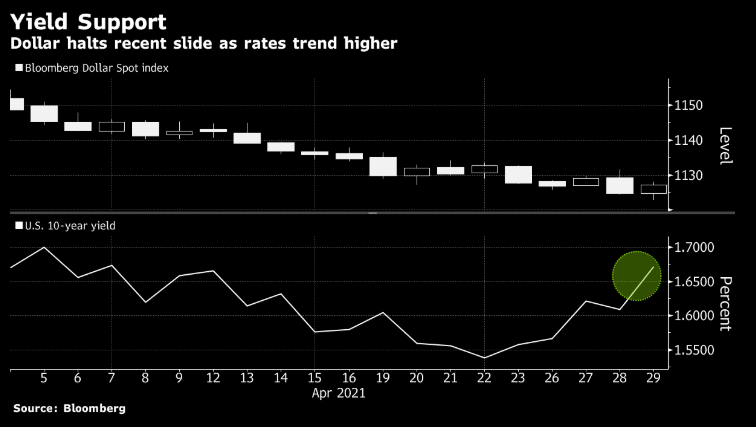
The dollar topped most Group-of-10 currency peers as 10-year Treasury yields rose to the highest in two weeks amid mounting inflation expectations and data showing U.S. economic growth is accelerating. The Canadian dollar outperformed as oil climbed and copper neared an all-time high.
Treasury 10-year yield up 3bps at 1.64%, paring a gain of as much as 8bps, as TIPS break evens touched the highest since 2013. Among G-10 peers, the greenback outperformed most except for the loonie and pound; the Swedish krona and Australian dollar lagged the pack.
USD/JPY climbed 0.3% to 108.94; rose as much as 0.6% to 109.22, highest since April 13. EUR/USD -0.1% to 1.2119 after earlier hitting the highest since February; options suggest further spot gains may come at a slower pace.
GBP/USD rose 0.1% to 1.3944, after earlier rising to the highest in over a week as UK PM facing a political risk. USD/CAD dropped 0.3% to 1.2283, earlier fell to 1.2281, lowest since February 2018; leads G-10 gains as WTI oil rises for third day.
Technical Analysis:
EURUSD (4 hour Chart)
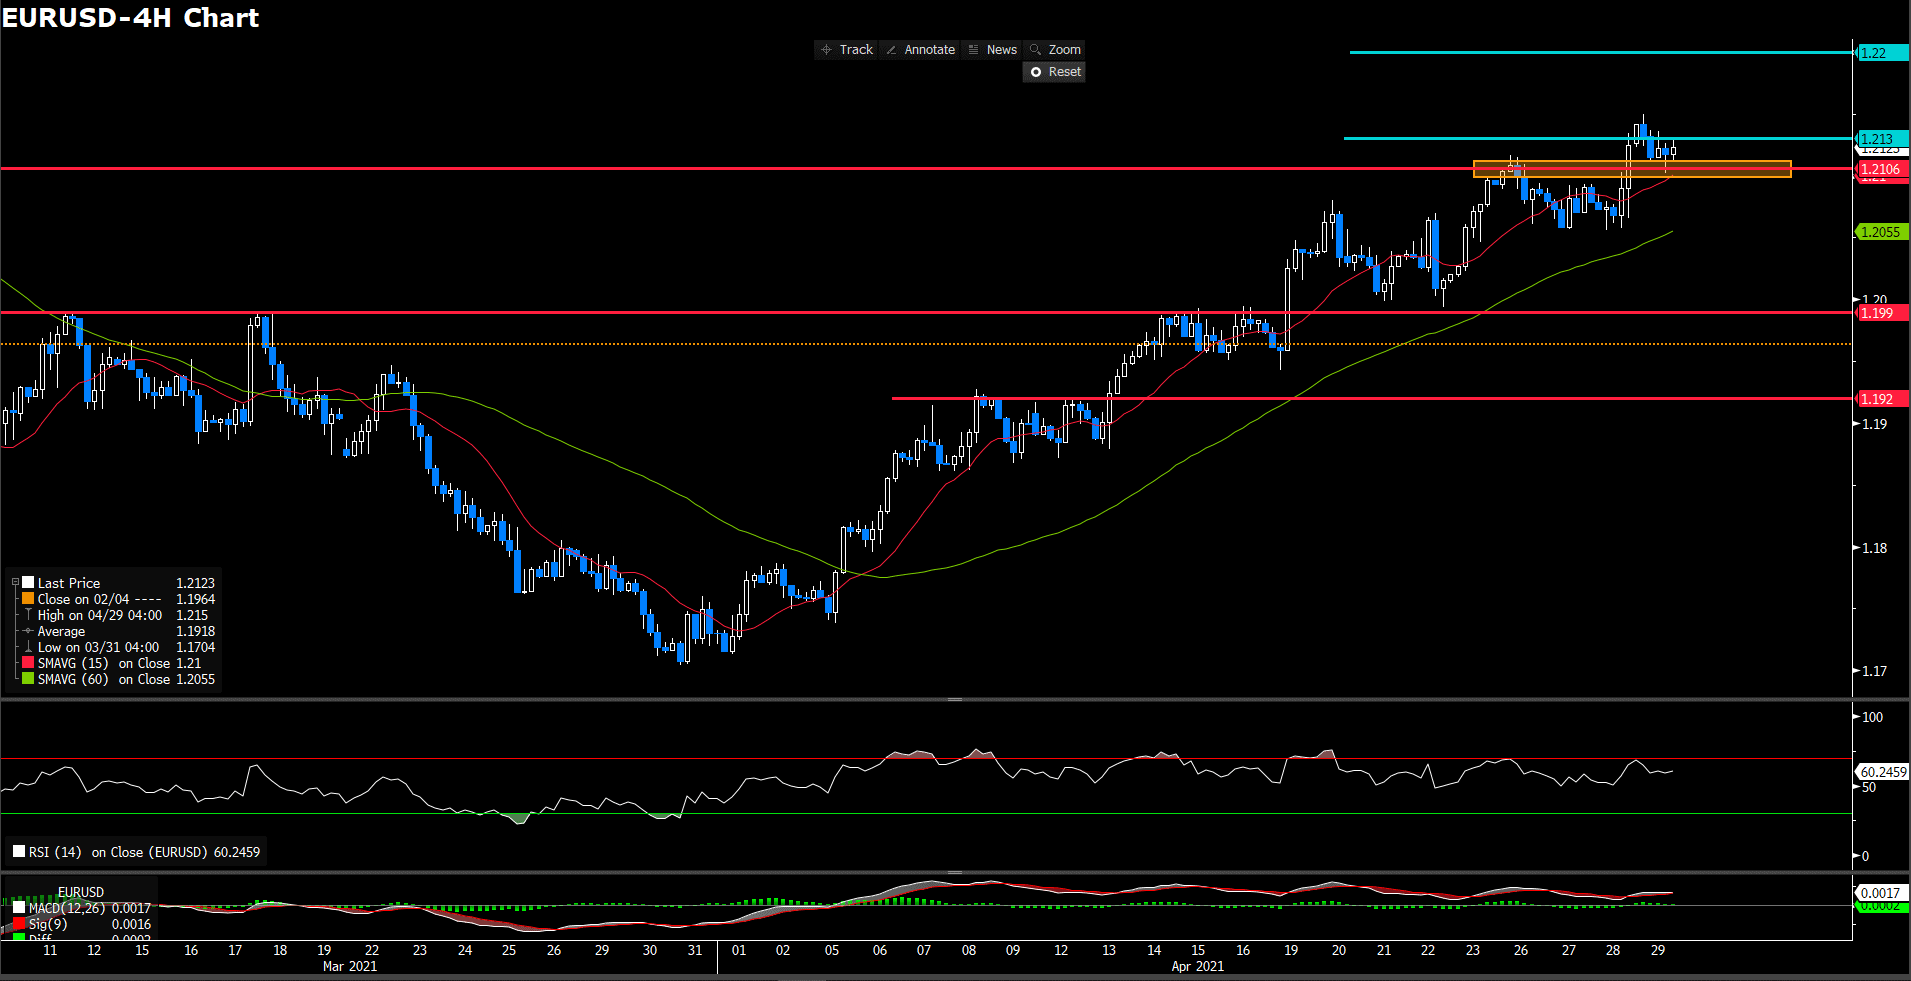
Euro dollar retains monthly gains after reached top 1.2149 but stifle by 1.213 level while outerperformance U.S. data failed to push the greenback forward, trading at 1.213 as of writing. For RSI side, indicator shows 60.3 figures, suggesting a room for bullish momentum at least for short term. On moving average price, 15 and 60-long SMA indicator remain an ascending movement.
Overall, we expect there still have a upper-space as market sentiment remain a benign bullish momentum. Again, we need to eyes on euro dollar whether could emphatically stand above 1.2106 level.
Resistance: 1.213, 1.22
Support: 1.2106, 1.199, 1.192
USDJPY (4 Hour Chart)
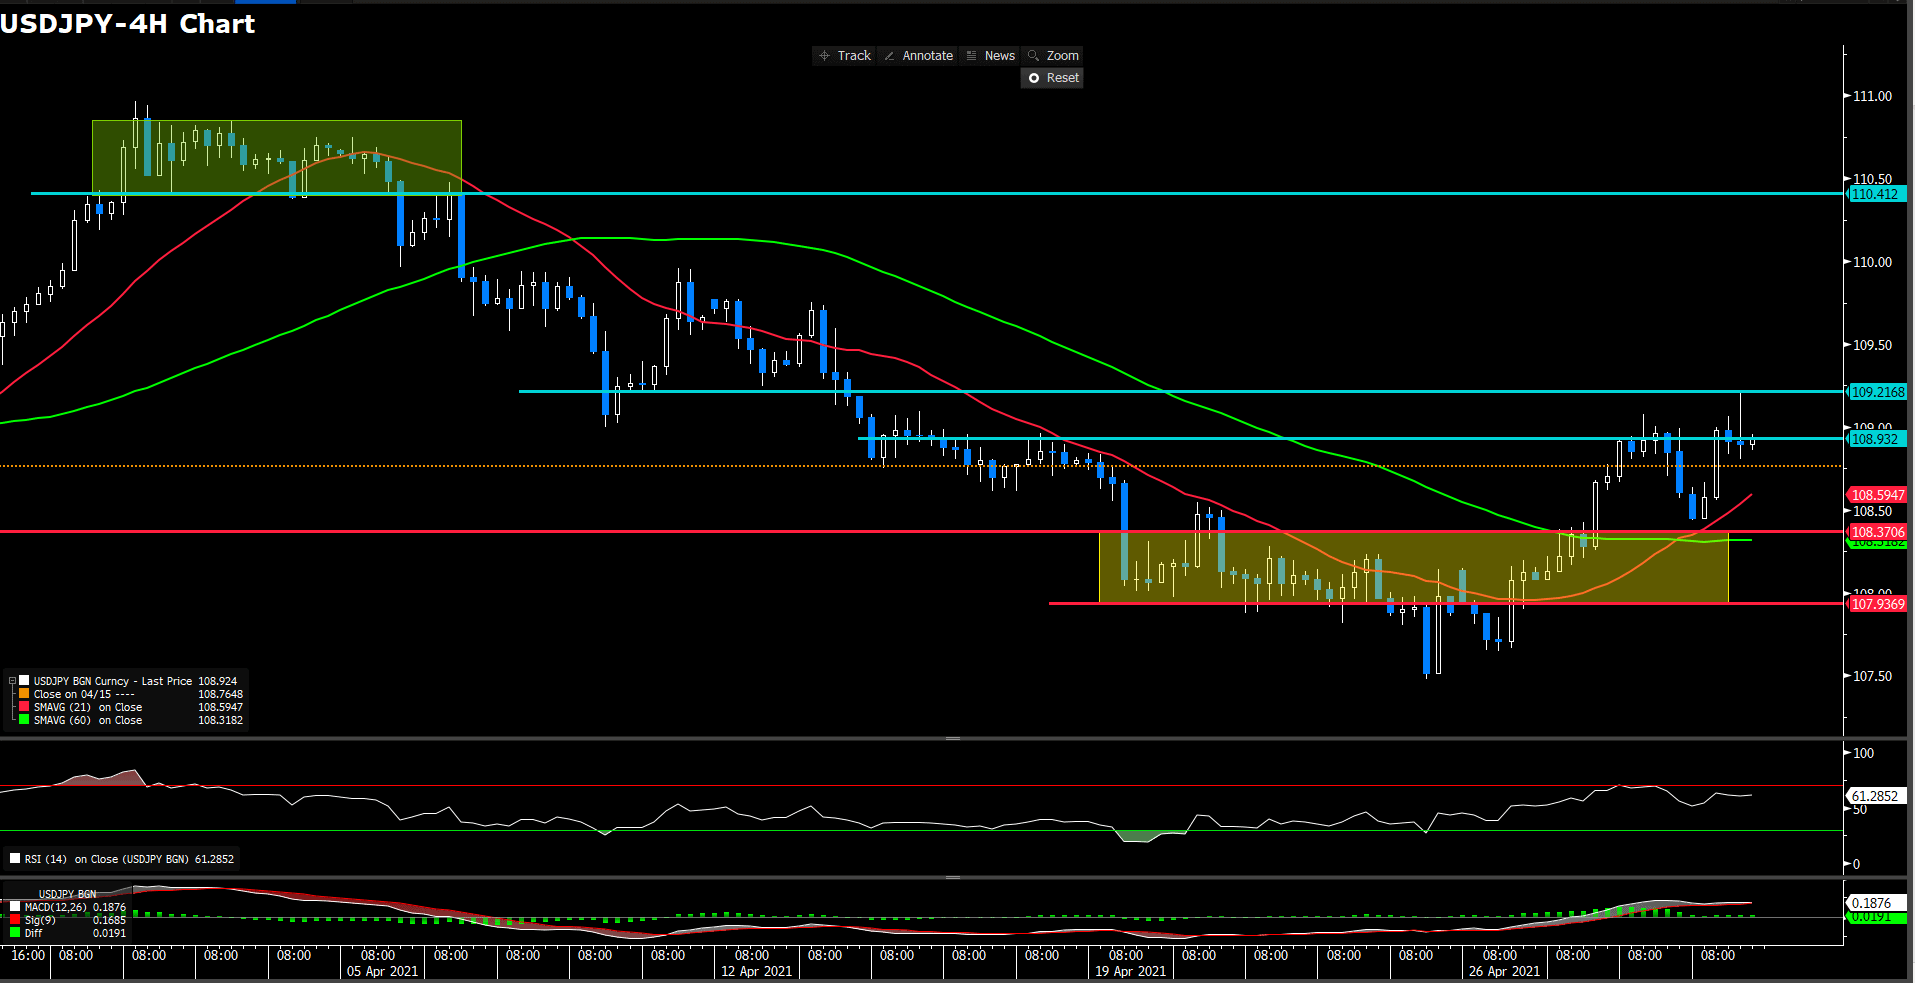
Japan yen retreat yesterday weakness from Fed’s impact that once hit all day high 109.22 then slightly fell to 108.9 when market close. For RSI side, indicator has ratched up to 61 figures, suggesting an optimistic sentiment for bull movement. Moreover, 15-long SMAs has golden cross 60-long one although 60-long SMA remain a smooth movement.
In lights of day move, we foresee market is establishing a upward momentum as price action and market sentiment. In order maintaining bull move, neckline of “V” pattern should be the immediately defend level, 107.937 following. On up way, if yen could penetrate day high level, place at 109.22, it could spur more buy side demand.
Resistance: 108.93, 109.22, 110.412
Support: 108.37, 107.936
USDCAD (Daily Chart)
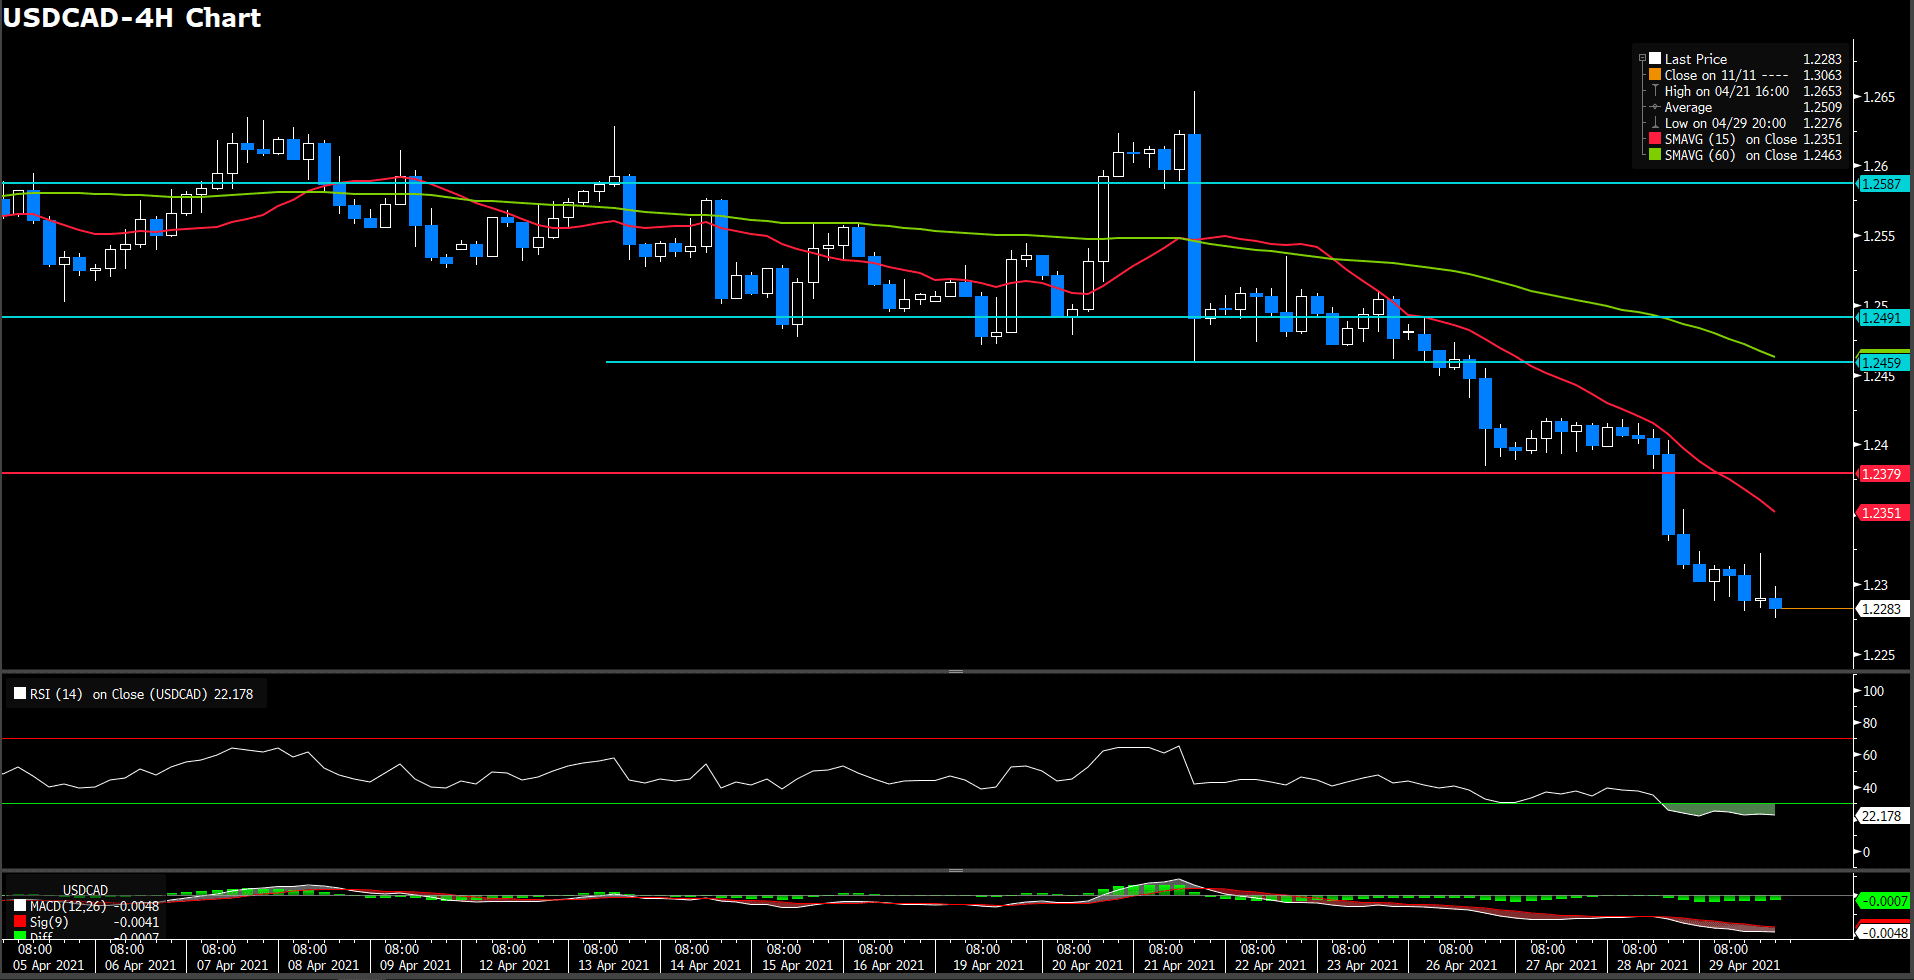
After breakthrough support at 1.238 level, loonie continue it downward momentum to nearly three year fresh low that trading at 1.228 as of writing. For moving average side, 15 and 60-long SMAs remaining a descending trend. For RSI side, indicator has slipped into the over sought territory at 22 figure, suggesting an over pessimetic sentiment at the moment.
Continue our recently perspective, we estill expect loonie will have an immense space for downward trend as it penetrated 2 years neckline. However, consecutive 2 days over sought sentiment of RSI indictor which we consider will have a mean reverse in imminet days. Otherwise, we do not see any support level on lower bound in long term view.
Resistance: 1.238, 1.246, 1.2491
Economic Data
|
Currency |
Data |
Time (GMT + 8) |
Forecast |
||||
|
CNY |
Manufacturing PMI (Apr) |
09:00 |
51.7 |
||||
|
CNY |
Caixin Manufacturing PMI (Apr) |
09:45 |
50.8 |
||||
|
EUR |
German GDP (QoQ)(Q1) |
16:00 |
-1.5% |
||||
|
EUR |
CPI (YoY)(Apr) |
17:00 |
1.6% |
||||
|
CAD |
GDP (MoM)(Feb) |
20:30 |
0.5% |
||||
|
USD |
Michigan Consumer Sentiment |
22:00 |
87.4 |
||||

Situs ini menggunakan cookie untuk memberimu pengalaman pengguna yang luar biasa.
Dengan menggunakan vtmindo.com, kamu menerima kebijakan cookie kami.


![]()
Follow us on:


![]()