Daily Market Analysis
Market Focus
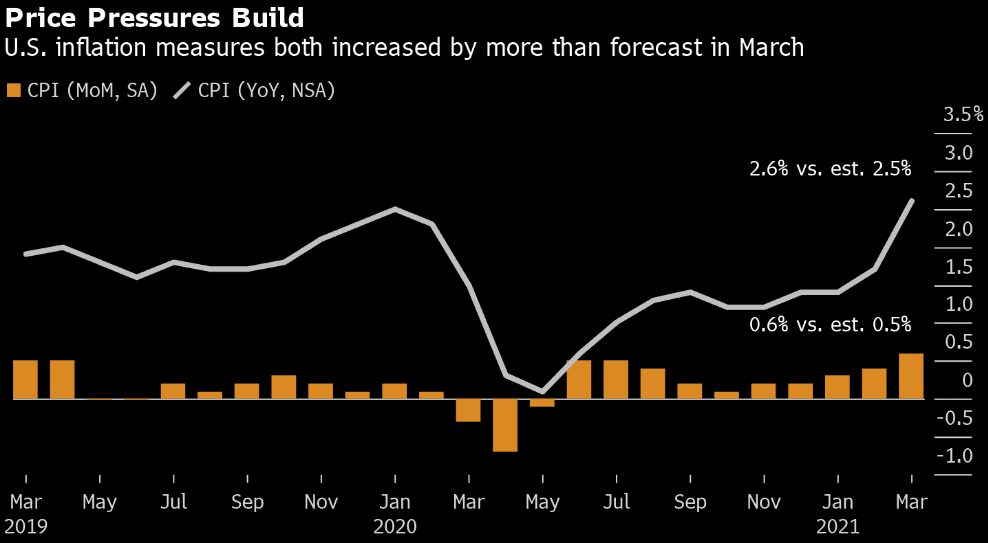
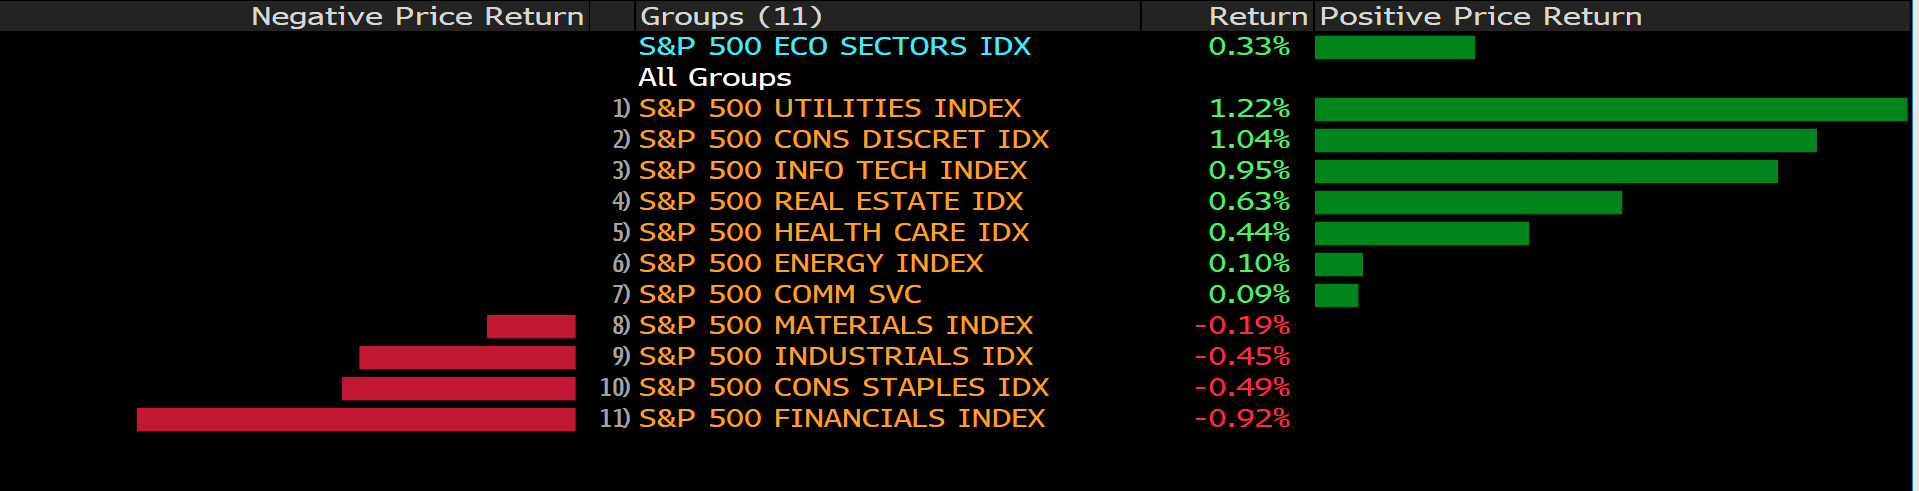
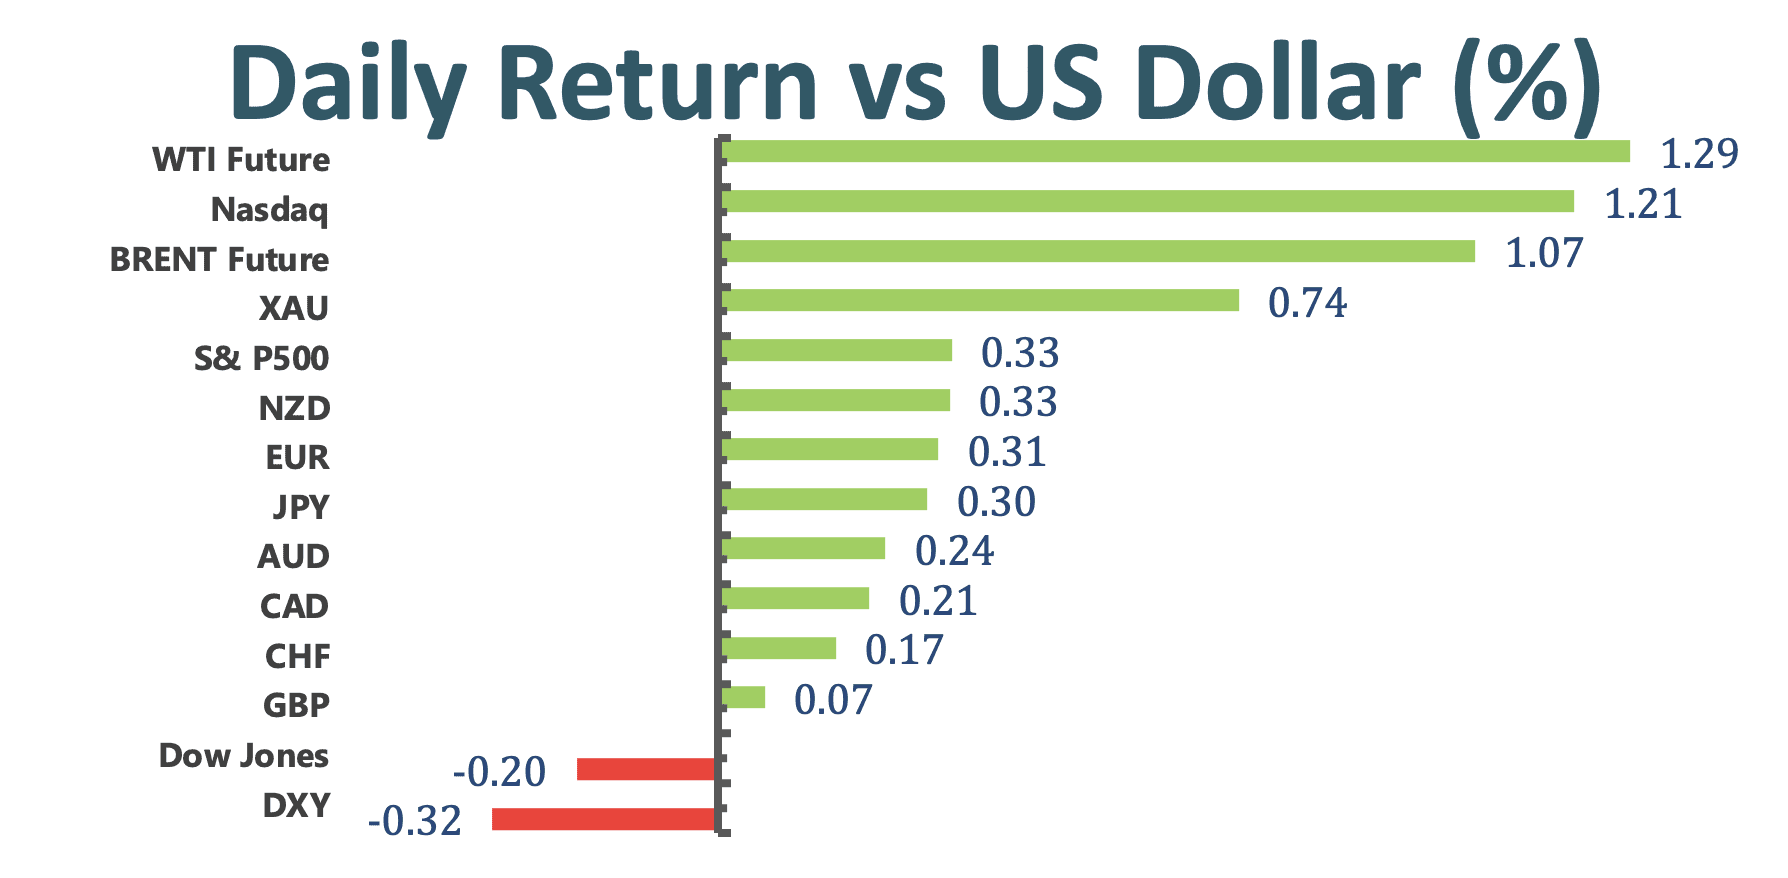
US stock market rose to fresh record highs and the US bond yields fell as investors bet that a higher-than-expected inflation data will not slow down the economy recovery. The S&P 500 hit all- time high even though Johnson& Johnson vaccine got paused by the US officials with the investigation into a link from its shot to blood clots. All told, the S&P 500 added additional 0.45% to new high; the Nasdaq climbed 1.1% whilst the Dow Jones Industrial Average dropped less than 0.1%.
Bitcoin surged to an all- time high ahead of Coinbase Global Inc.’s listing this week on the 14th. Major currencies turned bullish in force as growing list of companies embrace Bitcoin, even some are still skeptical about the durability of the boom. In one of the most potent signs of Wall Street’s growing acceptance of Bitcoin, Coinbase will list on the Nasdaq at a valuation of about $100 Billion with roughly $343.58 per share. The debut of Coinbase will help currencies move one big step further in public. A successful addition to the Nasdaq will act as endorsement of currencies.
Vaccine Blood- clot side effect put concern toward AstraZeneca Plc and Johnson and Johnson. The syndrome is highly unusual in that it involves increased blood clotting along with low levels of platelets. Thus, US FDA recommended for pause on both companies’ vaccines. As a result, Johnson and Johnson’s share dropped around 2%.
Market Wrap
Main Pairs Movement:
Chinese Yuan extended gain to April high as the US dollar approached a monthly low. CNH was up 0.09% to 6.5418 per US dollar, gaining 0.25% this week. CNH gained strength as investors looked through China’s March trade data, which showed a $13.8 billion surplus. Furthermore, US Treasury Secretary Janet Yellen will decline to name China as a currency manipulator, boosting Yuan.
Crude oil rose about 1.2% after OPEC predicted that a rapidly economic recovery is going to absorb the extra oil supply, allowing OPEC members and allies to proceed with their agreement on increasing oil production.
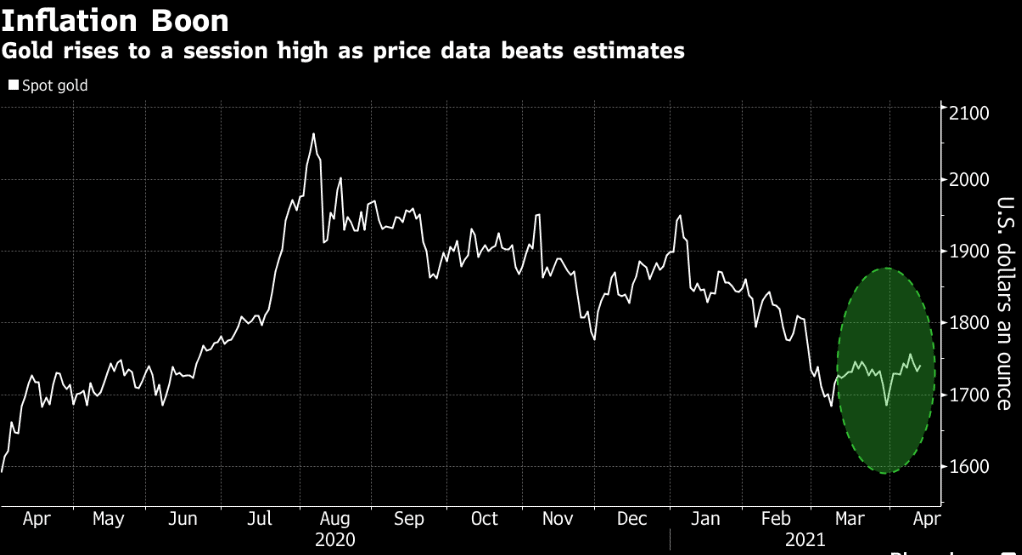
The precious metal, gold advanced as the measure of US inflation rose by the most in nearly nine years. However, even with today’s gain, gold remained pressured by rising US bond yield. Gold price usually goes up when inflation becomes a threat since gold is used as an inflation hedge.
Technical Analysis:
EURUSD (Daily Chart)
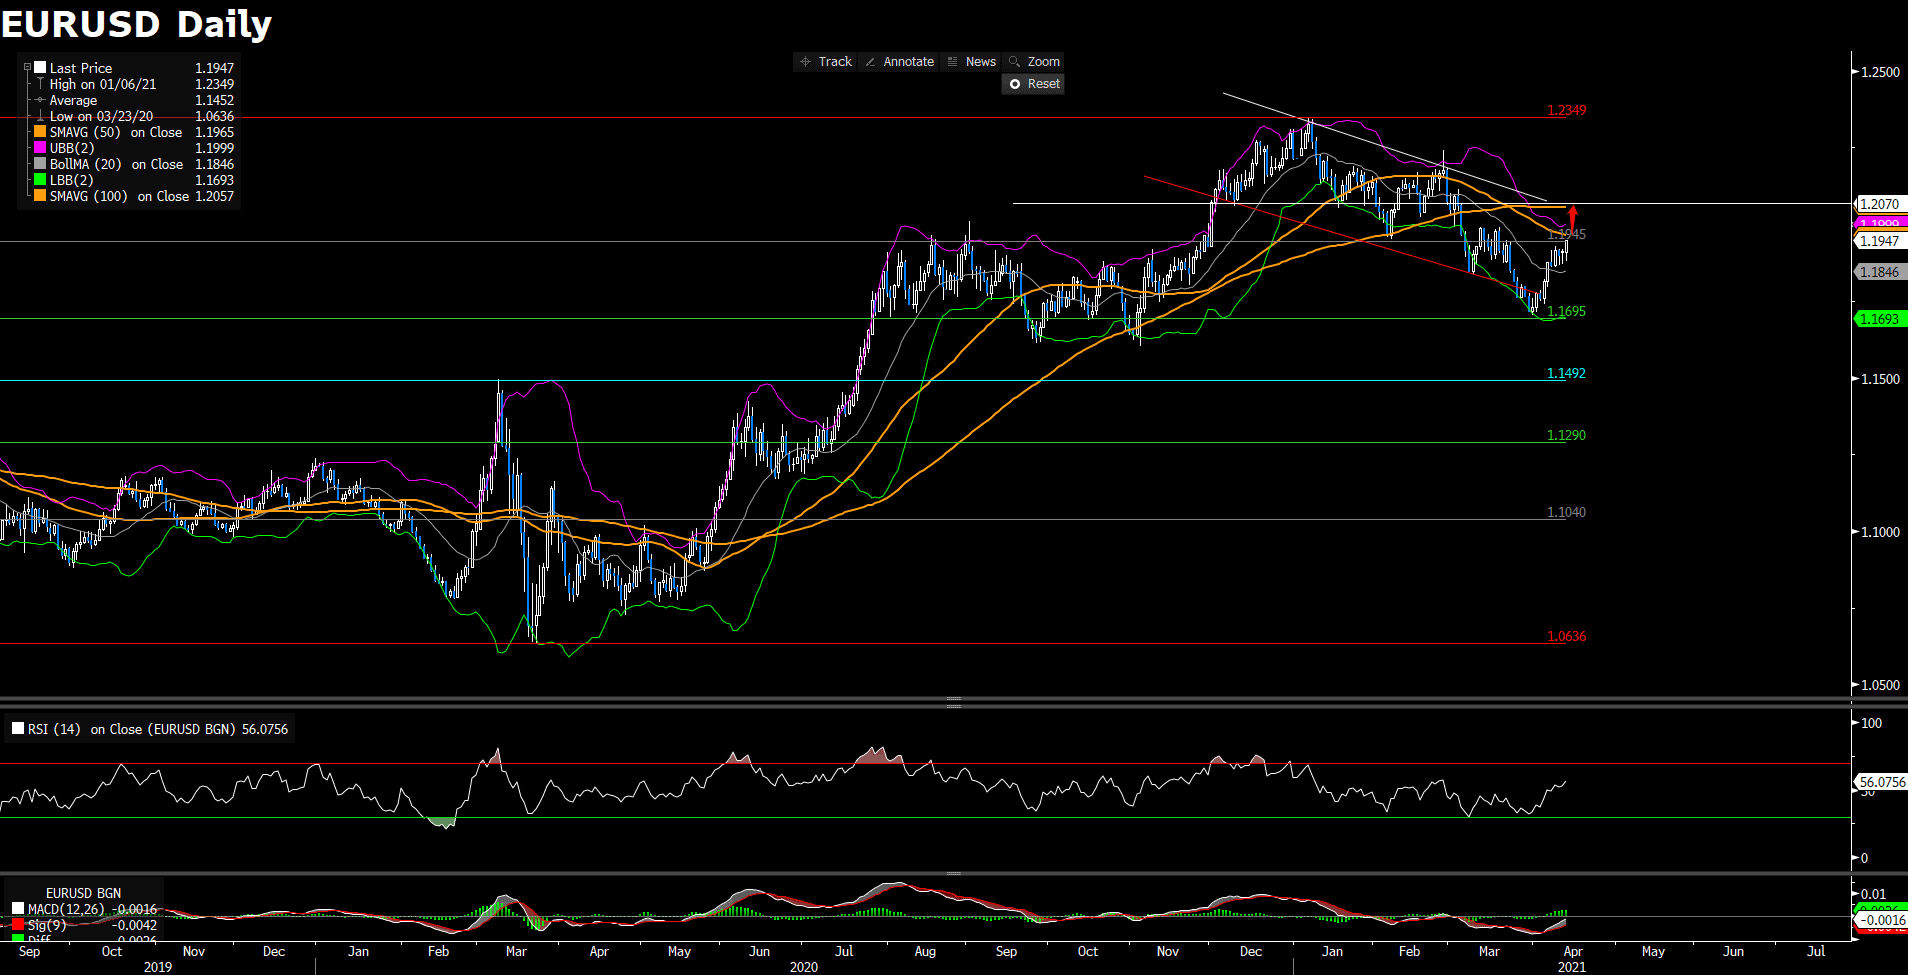
EURUSD surges well above 1.19, as markets have reassessed US inflation data. The near- term outlook is neutral- to- bullish as the pair has outbreached yearly resistance at 1.1945. At the same time, the pair almost reaches the level above the 50 SMA, opening up a path for EURUSD to accelerate its bullish momentum further north toward 1.20 level, specifically 1.2070, a minor resistance. The technical indicator, MACD continues to lend support to bulls whilst the RSI is still out of the overbought territory, giving the pair rooms to keep up its current momentum.
Resistance: 1.2070, 1.2349
Support: 1.1945, 1.1695, 1.1492
USDJPY (Daily Chart)
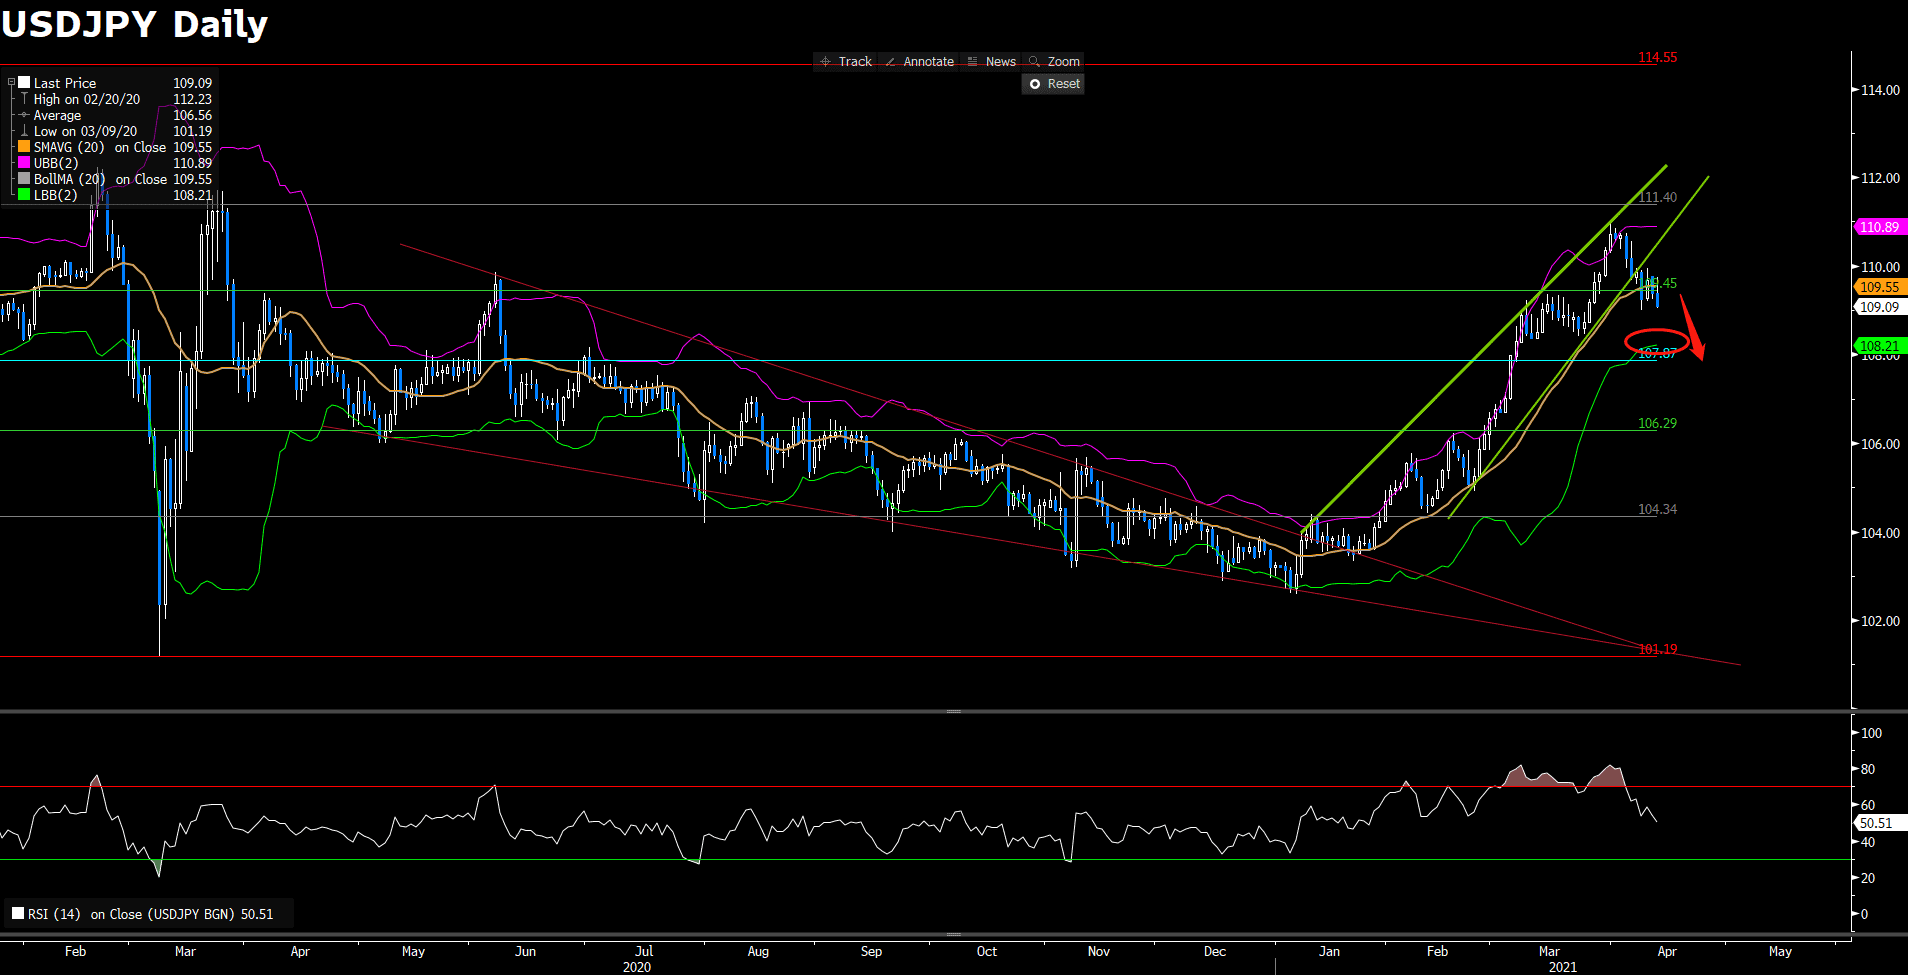
USDJPY is falling to convince an upward trajectory and the focus is on the downside; bears seek downside continuation on the daily chart. The pair looks poised to extend its slide further south as it breaks below the support level at 109.45 as well as the midline of Bollinger Band. Additionally, the pair has broken the ascending channel, suggesting a downside acceleration toward the next immeidate support at 107.87. Furthermore, the technical indicator, RSI is still outside of the oversold territory, giving the pair rooms to extend further south. To the downside, USDJPY might possibly confront a obstacle, the lower bound of Bollinger Band, around 108.22, before touching the support level at 107.87.
Resistance: 111.40, 114.55
Support: 107.87, 106.29
XAUUSD (Daily Chart)
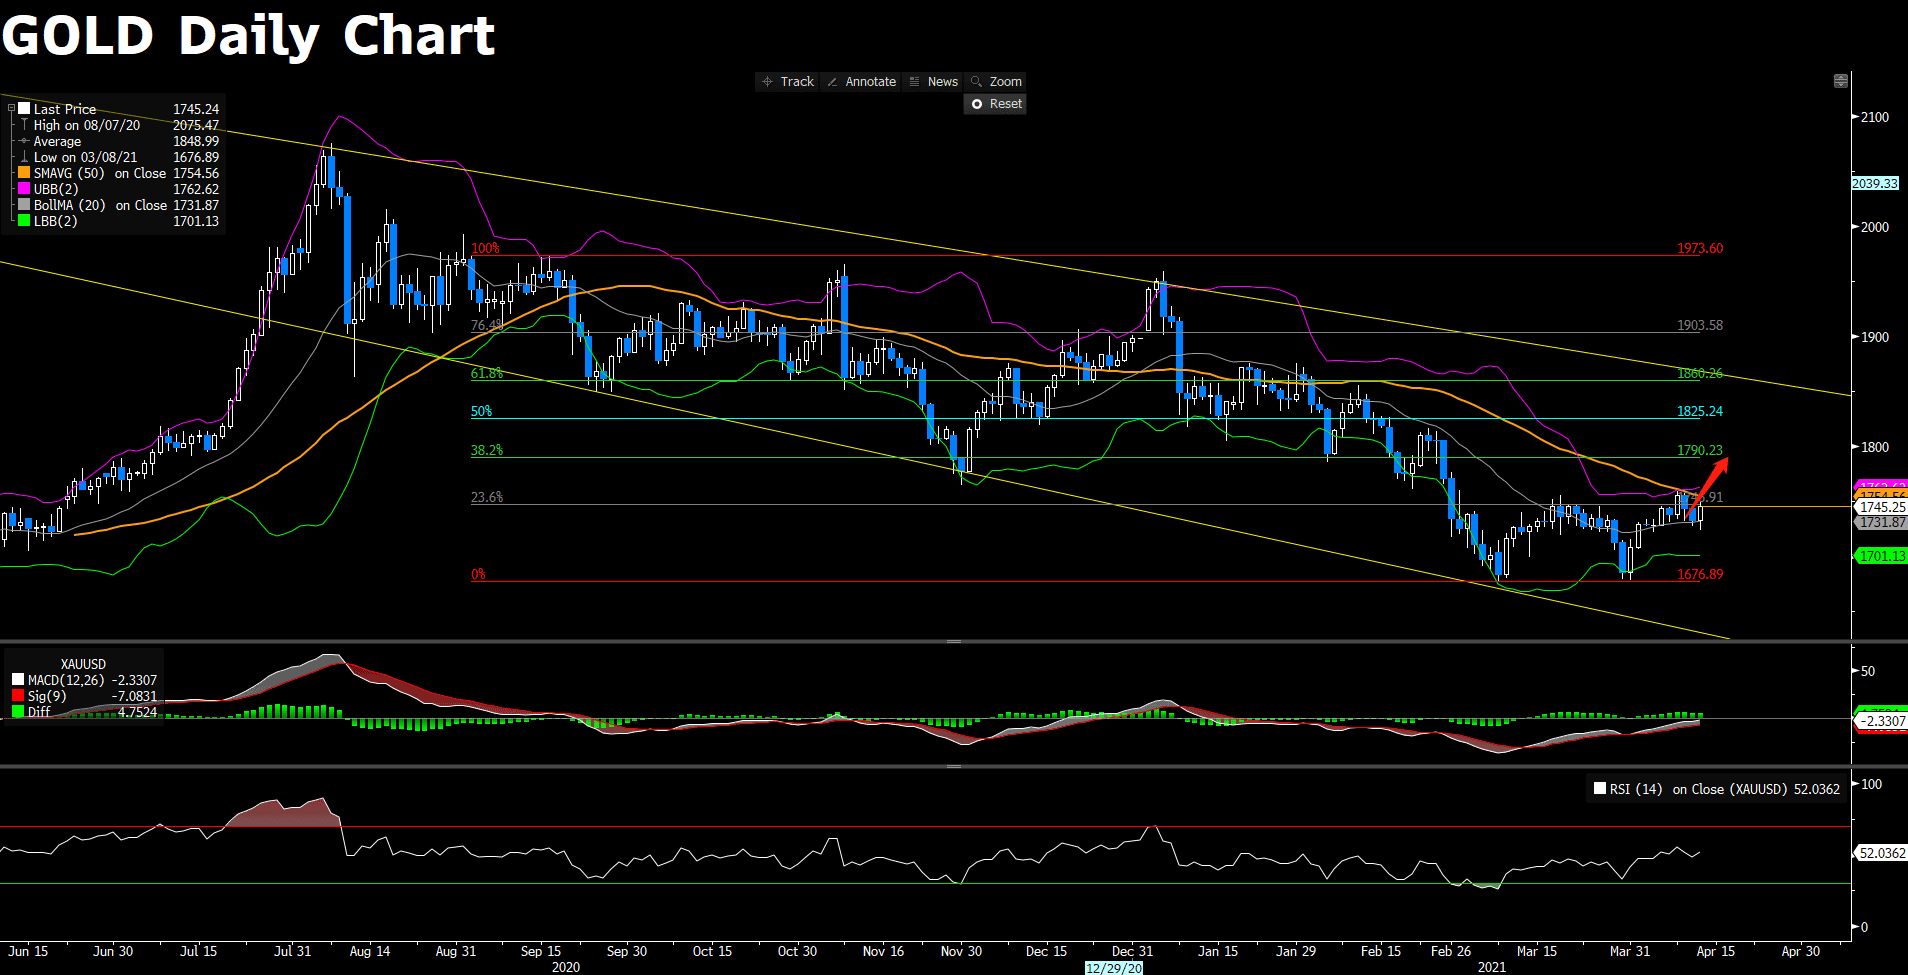
A little hesitation after Gold broke above the obstacle at 1746.91 yesterday; today, gold challenges the resistance once again, boosted by a renewed selling pressure surrounding the greenback after the inflation data. On the daily chart, a double bottom pattern still exists indicating a buy and bullish signal. As the time of writing, former resistance $1746.91 now acts as a strong support pivot, possibly pushing gold toward the next resistance at $1790.23. Moreover, the MACD continunes to lend support to bulls whilst the RSI of 52 has not yet reached the overbought territory, giving gold more room to extend further north.
Resistance: 1790.23, 1825.24, 1860.26
Support: 1746.91, 1676.89
Economic Data
|
Currency |
Data |
Time (GMT + 8) |
Forecast |
||||
|
NZD |
RBNZ Interest Rate Decision |
10:00 |
0.25% |
||||
|
NZD |
RBNZ Rate Statement |
10:00 |
N/A |
||||
|
EUR |
ECB President Lagarde Speaks |
22:00 |
N/A |
||||
|
USD |
Crude Oil Inventories |
22:30 |
-2.889 m |
||||

Situs ini menggunakan cookie untuk memberimu pengalaman pengguna yang luar biasa.
Dengan menggunakan vtmindo.com, kamu menerima kebijakan cookie kami.


![]()
Follow us on:


![]()