Daily Market Analysis
Market Focus
Stocks rallied a day after violence rocked the U.S. Capitol, with investors firmly focused on the prospect for more stimulus and the likelihood that calm will prevail as Joe Biden takes the presidency.
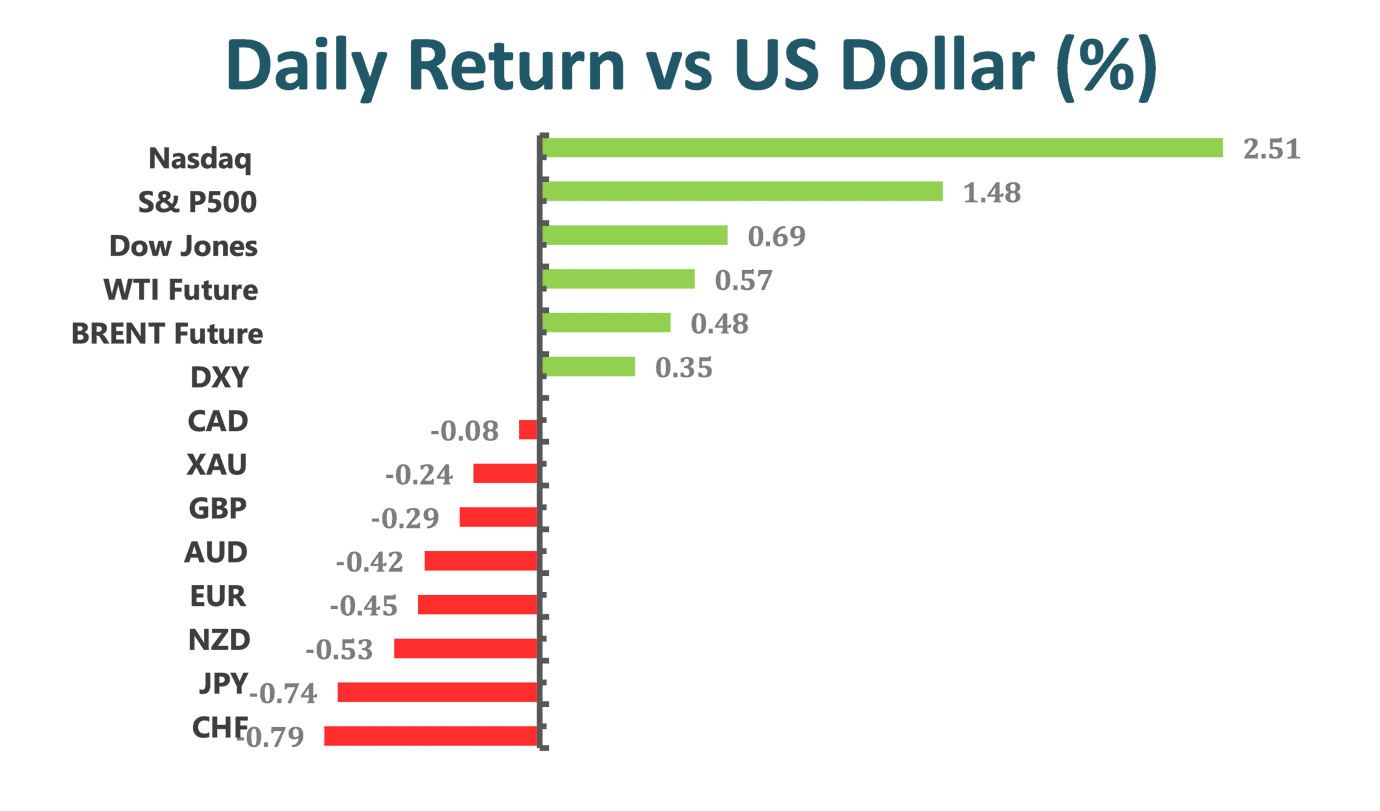
All major U.S. equity benchmarks were on track for all-time highs, with nearly 70% of the companies in the S&P 500 in the green and the Nasdaq 100 jumping 2.5%. The Dow Jones Transportation Average, a proxy for economic activity, also climbed toward a record. Tesla Inc. surged after RBC Capital Markets upgraded the stock, noting it was “completely wrong” with a previous bearish view. Another notable call came from Goldman Sachs Group Inc., which said banks have “moved back into vogue” due to optimism about fiscal aid and rising rates. Bitcoin pared gains after topping $40,000.
House Speaker Nancy Pelosi and Senate Democratic leader Chuck Schumer demanded that President Donald Trump’s cabinet immediately remove him from office and threatened a new drive to impeach him if they don’t act. Democrats, who already have a majority in the House, are set to take control of the Senate and presidency, paving the way for Biden to bring his legislative agenda to life and reshape the economy.
Data showed that growth at U.S. service providers unexpectedly accelerated as gains in business activity and new orders helped offset a decline in a measure of employment. Federal Reserve Bank of Dallas President Robert Kaplan said officials shouldn’t intervene to slow rising bond yields because that’s expected to happen as the economy recovers.
Market Wrap
Main Pairs Movement
The dollar advanced to a one-week high Thursday as spillover from broadly weaker emerging-market currencies dented the greenback’s Group-of-10 currencies and as dollar shorts were unwound. U.S. Treasury 10-year yields rose to the highest since March.
The dollar gauge advanced the most in over two weeks as real money unraveled short-dollar positions and as weakness in currencies such as the Mexican peso and offshore yuan filtered into G-10 currencies; the offshore yuan fell as much as 0.4% against the dollar while the South African rand fell as much as 2.7% in its biggest one-day loss in over three months vs the USD.
Among G-10 peers, the Canadian dollar was the most resilient while the yen and Swiss franc led losses. The dollar rose to the highest since Dec. 15 against the yen amid fast-money demand, according to a New York-based trader. The yen also weakened as fast-money accounts unwound USD/CNH downside, the trader added.
Technical Analysis:
AUDUSD (4 Hour Chart)
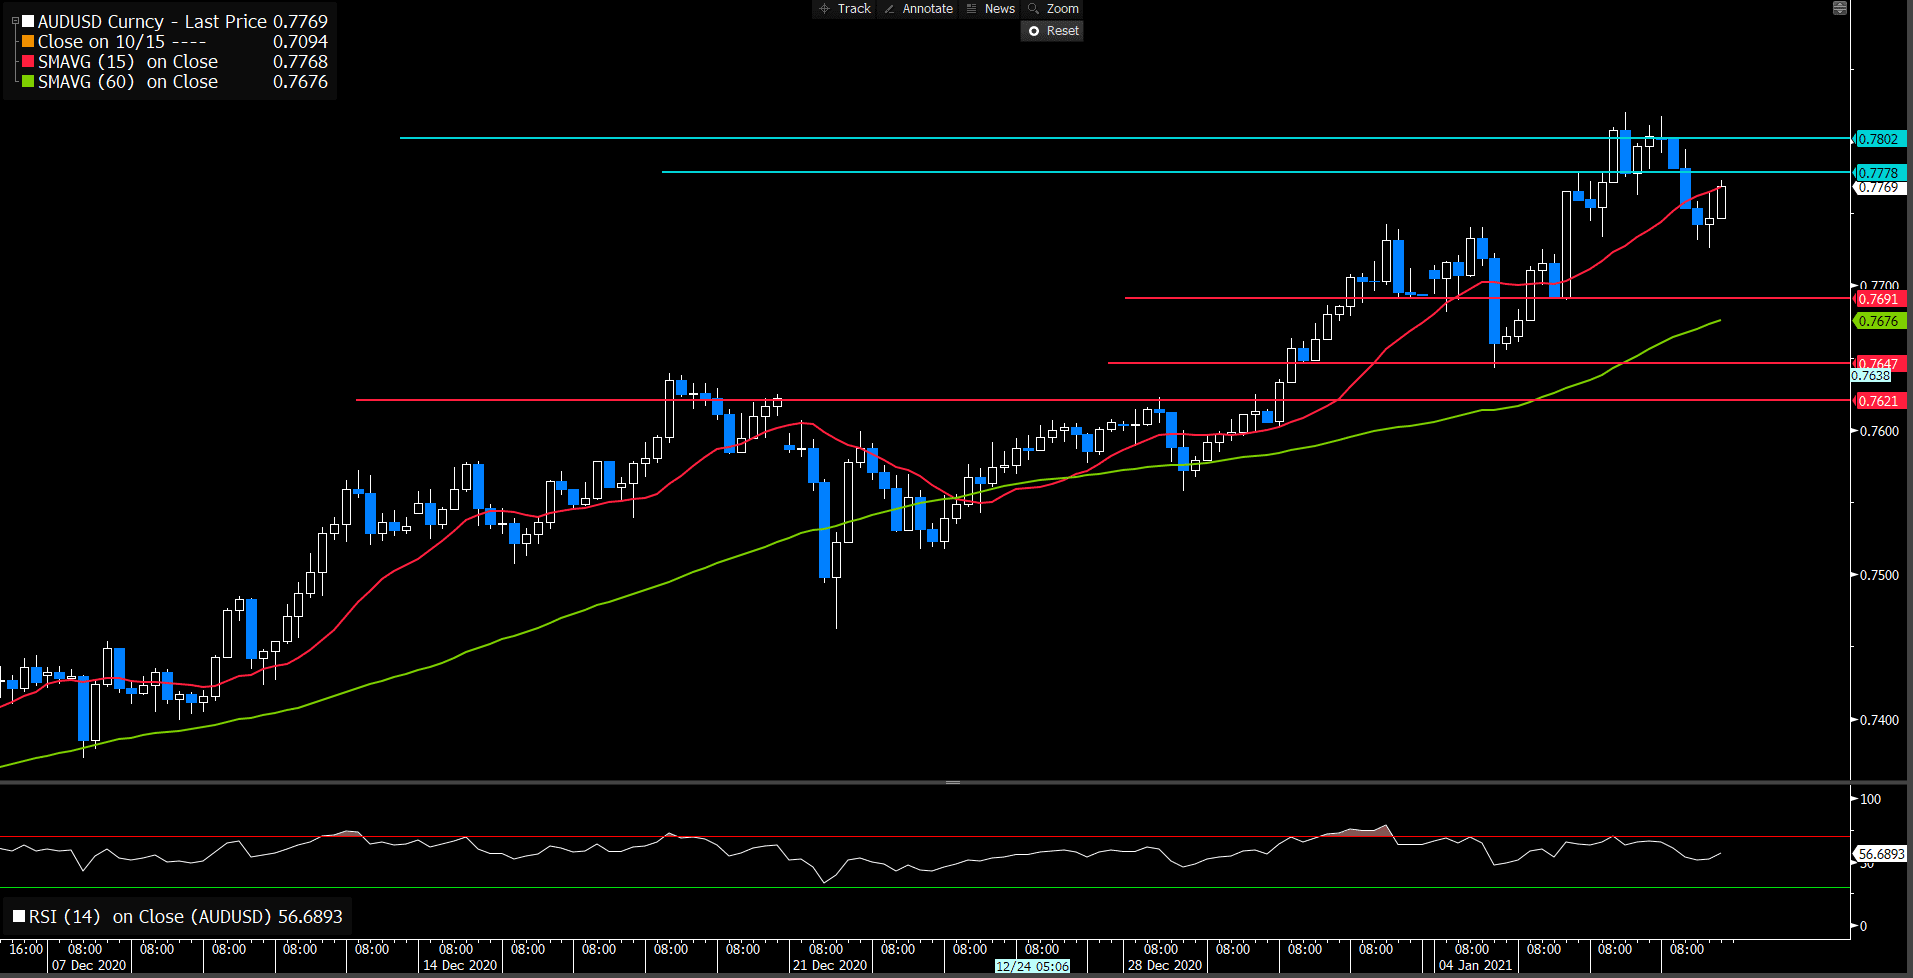
Aussie reverses Thursday’s earlier losses while picking up the bids near 0.777-75 during the early Friday morning in Asia. The aussie pair had to bear the burden of political drama in the US, which mainly triggered the greenback run up while snapping the two-day uptrend the previous day. However, hopes of the American stimulus propelled Wall Street benchmarks by the end of the day and favored the Aussie bull’s return.
Resistance: 0.7778, 0.78
Support: 0.7691, 0.7647, 0.762
USDJPY (4 Hour Chart)
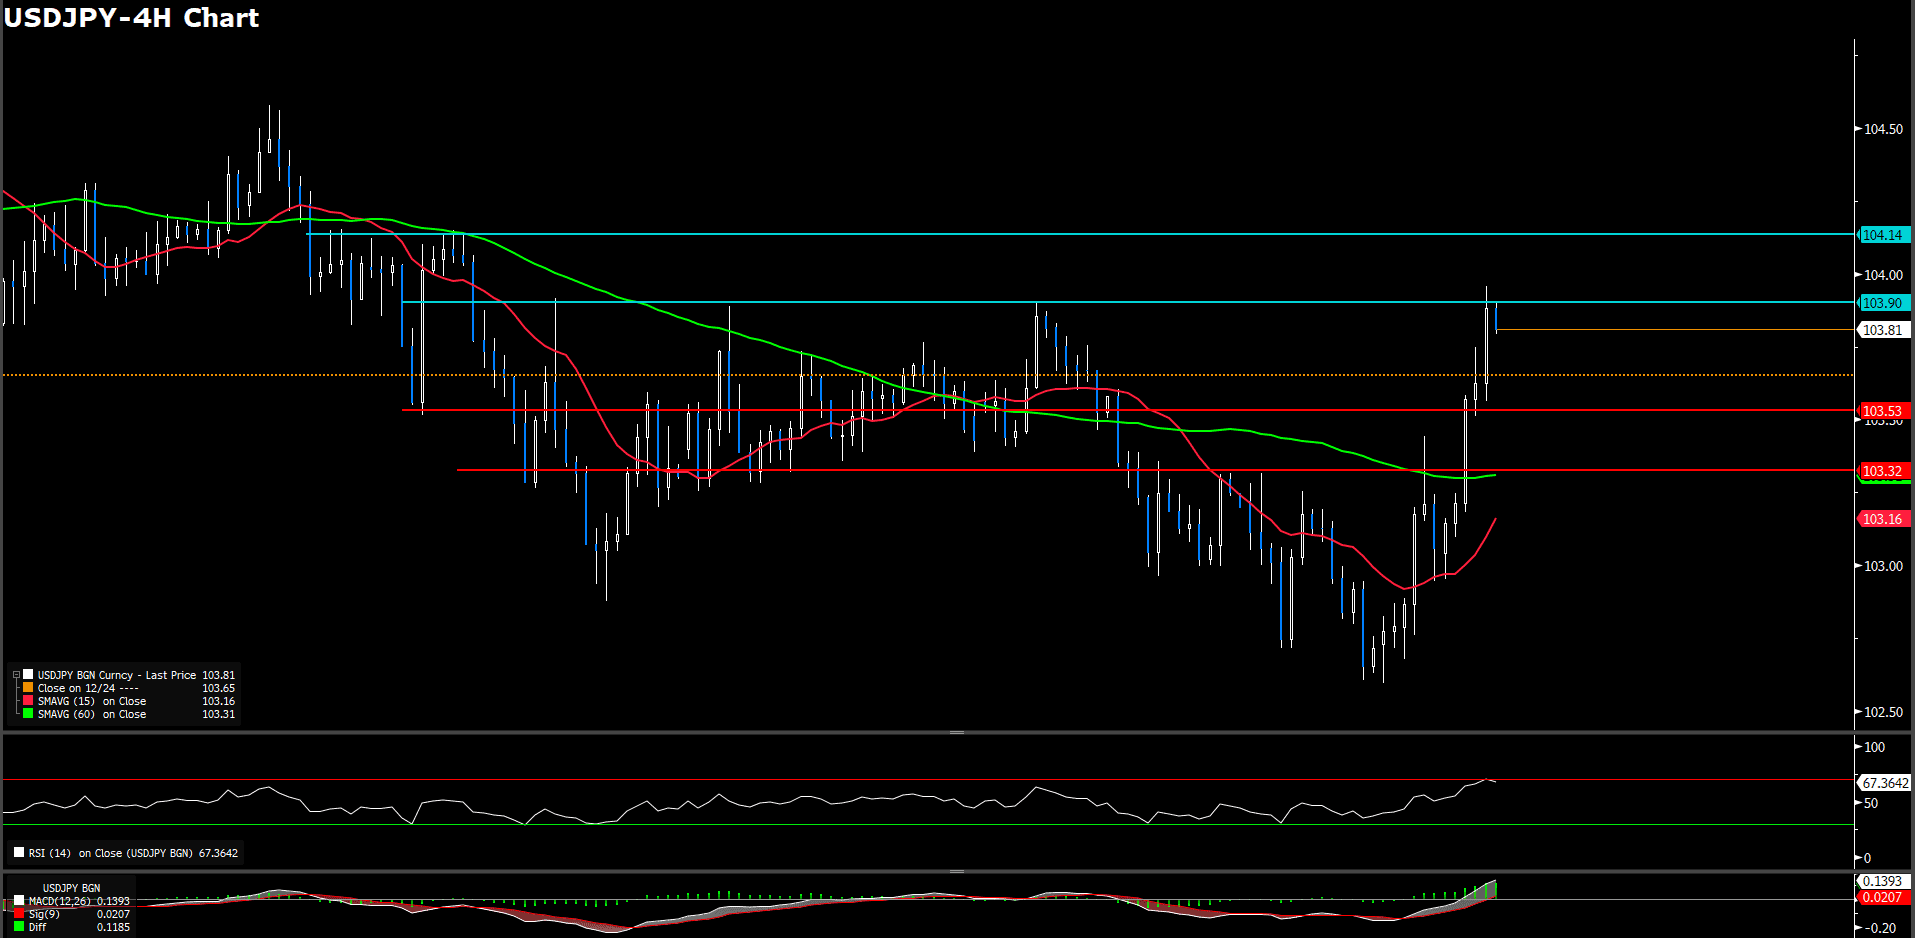
USD/JPY is up 0.8%; tests session high of 103.96 as bids continue to grind away at short dollar-yen positions, driving the pair toward 104.00, which also marks the 50-DMA. Traders in North America see stop-loss buy-dollar orders building between 104.10-104.20 with some initial resistance ahead of stops at 104.05, which coincides with the 55-DMA. Japan’s finance ministry comments on the recent strength of the yen vs the greenback also pressured the currency.
Skews and implied on the yen eased as the dollar, Treasury yields, and shares rose.
As price action, currently yen is having a downwind trend but seemingly approach a critical resistance at 103.9 gird. Whilst RSI indicator close at 67 which suggesting a bullish momentum ahead. For Moving Average perspective, short-term indicator reverse to positive way and long-term indicator kick-start slightly went up.
Resistance: 103.9, 104.14
Support: 103.53, 103.32
XAUUSD (4 Hour Chart)
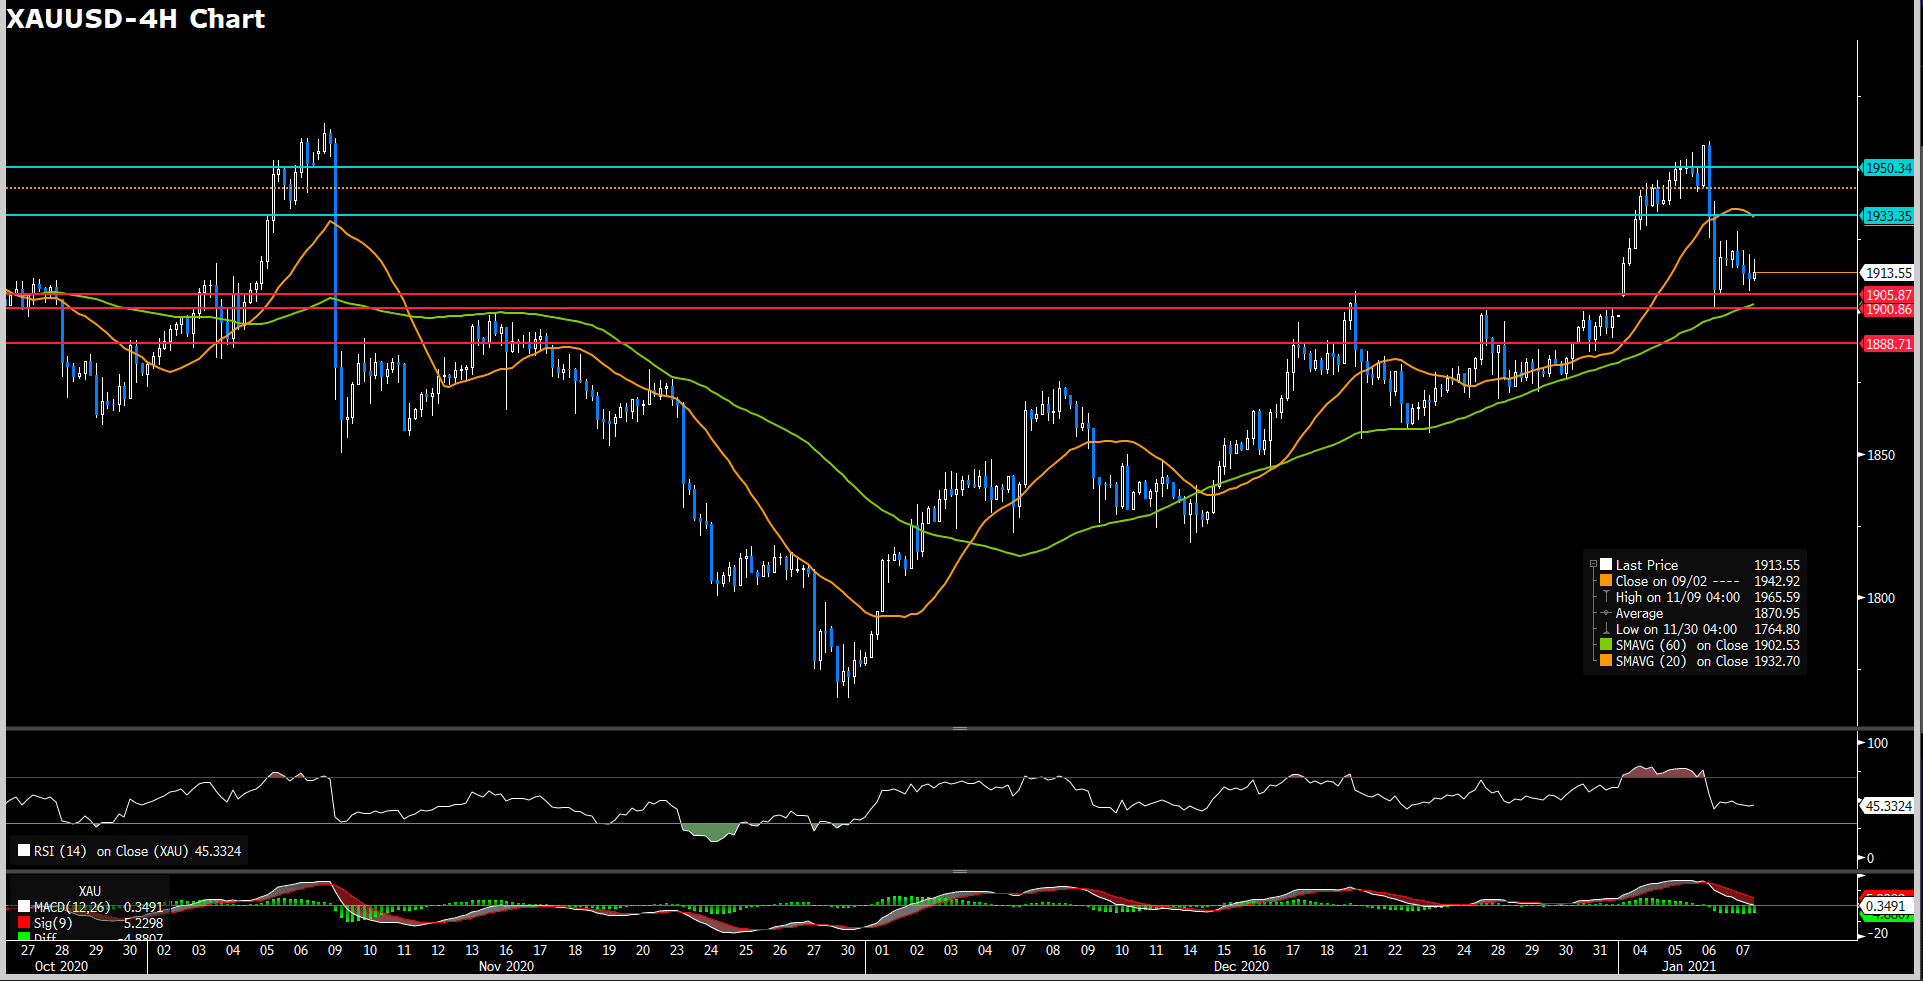
After rough fell from recently high, market move around a consolidation pattern currently and stood above on psychological support in 1900 as of writing. The worth noting, short period moving average indicator turn into negative slope while long period indicator remain upward trend momentum. For RSI aspect, indicator has through a drastic correction to under 50 after breach 80 figure once. Therefore, combing those suggestions from indicator, we expect gold market would mire into a consolidation range which is 1905 to 1933 around. Moreover, $1900 psychological support will remain critically for mid-term.
Resistance: 1933.35, 1947.55
Support: 1905, 1900, 1888
Economic Data
Click here to view today’s important economic data.

Situs ini menggunakan cookie untuk memberimu pengalaman pengguna yang luar biasa.
Dengan menggunakan vtmindo.com, kamu menerima kebijakan cookie kami.


![]()
Follow us on:


![]()